
Shopify annual metrics, fiscal years 2015 to 2025
Version 1. 11 rows, 13 columns. Next update February 11, 2027.
By Martin DejnickiUpdated Data through 2025
Short answer
The dataset holds Shopify's GMV, revenue, monthly recurring revenue, payments volume and Shopify Payments penetration for fiscal years 2015 to 2025. Figures come from Shopify's SEC filings, in US dollar millions unless a column says percent. Three computed columns, GMV growth, revenue growth and revenue as a percent of GMV, are Deploi's arithmetic, not Shopify statements.
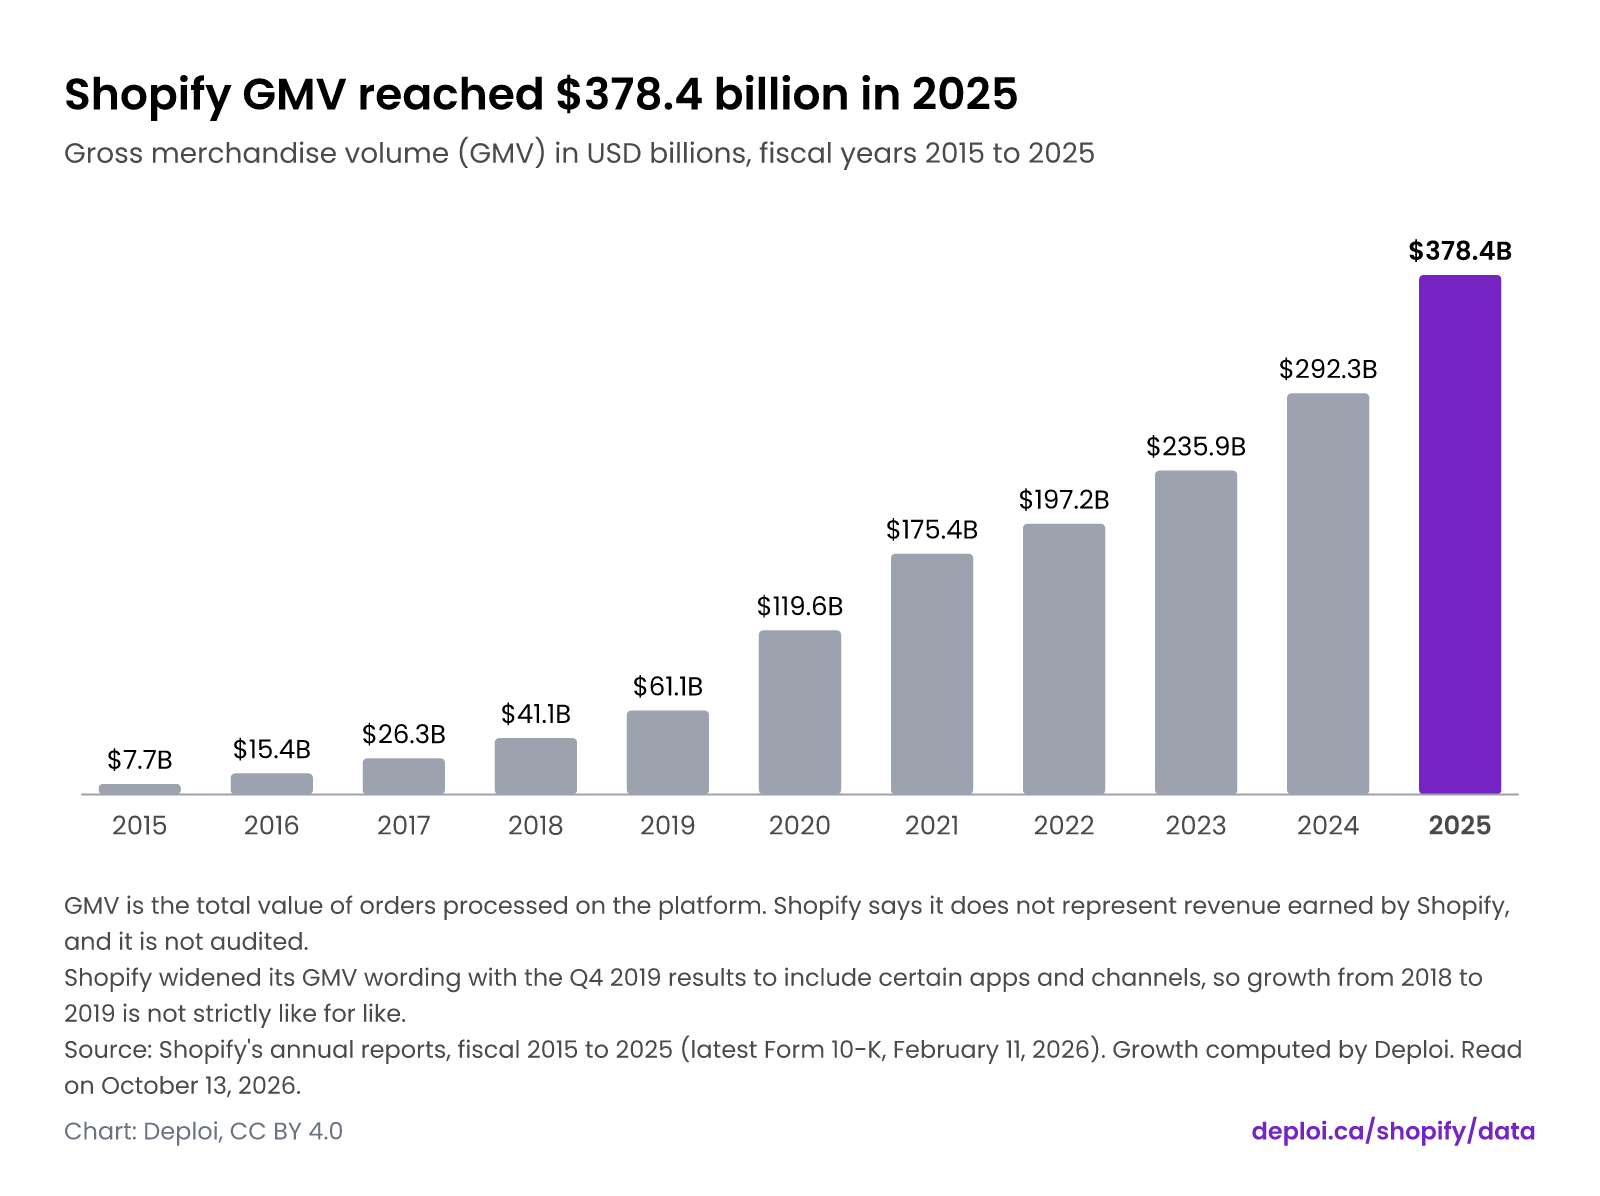
Shopify GMV reached $378.4 billion in 2025
Gross merchandise volume (GMV) in USD billions, fiscal years 2015 to 2025
- GMV is the total value of orders processed on the platform. Shopify says it does not represent revenue earned by Shopify, and it is not audited.
- Shopify widened its GMV wording with the Q4 2019 results to include certain apps and channels, so growth from 2018 to 2019 is not strictly like for like.
Source: Shopify's annual reports, fiscal 2015 to 2025 (latest Form 10-K, February 11, 2026). Growth computed by Deploi. Read on .
About this dataset
The dataset holds Shopify's GMV, revenue, monthly recurring revenue, payments volume and Shopify Payments penetration for fiscal years 2015 to 2025. Figures come from Shopify's SEC filings, in US dollar millions unless a column says percent. Three computed columns, GMV growth, revenue growth and revenue as a percent of GMV, are Deploi's arithmetic, not Shopify statements. Each row is one fiscal year, and every fiscal year ends on December 31. Revenue and its two lines come from SEC XBRL data; GMV, MRR and payments figures come from the annual reports and results releases, and the exact sentence or table row is stored for every value. Each value is the one in the most recently filed annual report that states the year. Changes of definition (GMV wording in 2019, MRR in 2024), the 2023 sale of Shopify's logistics businesses and every restated or rounded figure are recorded in the row notes and caveats.
- Version
- 1
- Coverage in time
- 2015 to 2025
- Coverage in space
- Worldwide (Shopify Inc., consolidated)
- Last updated
- October 13, 2026
- Next update
- February 11, 2027
- License
- CC BY 4.0. Deploi's compilation is CC BY 4.0. The underlying figures belong to Shopify and are cited to its SEC filings and results releases.
Variables
The CSV header uses the column name.
| Column name | Label | Type | Unit | Meaning |
|---|---|---|---|---|
| rowKey | Row key | string | Stable key of the row (the fiscal year as text); matches provenance rowKey. | |
| fiscalYear | Fiscal year | number | year | Shopify fiscal year. It ends on December 31, so it equals the calendar year in every row. |
| gmvUsdM | GMV (USD million) | number | USD million | Gross merchandise volume for the fiscal year as Shopify states it in the most recently filed annual report: the total dollar value of orders facilitated through the platform (from the Q4 2019 results also on certain apps and channels with a revenue-sharing arrangement), net of refunds, including shipping, handling, duty and value-added taxes. Not Shopify revenue. |
| revenueUsdM | Total revenue (USD million) | number | USD million | Total revenue under US GAAP, read by script from SEC XBRL (most recently filed annual report that reports the year). Includes revenue of the logistics businesses Shopify sold in the second quarter of 2023 up to the sale. |
| subscriptionRevenueUsdM | Subscription Solutions revenue (USD million) | number | USD million | Revenue from subscription plans, variable platform fees, apps, themes and domains (Shopify's 'Subscription Solutions' line), from SEC XBRL. |
| merchantSolutionsRevenueUsdM | Merchant Solutions revenue (USD million) | number | USD million | Revenue from Shopify Payments and other merchant services (Shopify's 'Merchant Solutions' line), from SEC XBRL. Subscription plus Merchant Solutions equals total revenue in every row. |
| mrrUsdM | MRR at December 31 (USD million) | number | USD million | Monthly recurring revenue on the last day of the fiscal year: the subscription plan fees in force that day, excluding variable platform fees. Latest published value; the Q1 2024 revision lowered the 2023 value from 149 to 144. Not revenue. |
| gpvUsdM | GPV (USD million) | number | USD million | Gross payments volume for the fiscal year: the part of GMV processed through Shopify Payments. Shopify states it in billions to one decimal, so each value has a rounding band of plus or minus 50 USD million. |
| paymentsPenetrationPct | Shopify Payments penetration (% of GMV) | number | % of GMV | GPV as a percent of GMV, as Shopify states it: whole percent for 2015 to 2017 (results releases), one decimal from 2018 (MD&A and Form 10-K). |
| gmvGrowthPct | GMV growth on prior year (%) | number | % | Computed by Deploi, not a Shopify statement: GMV divided by the previous fiscal year's GMV, minus 1, times 100, rounded half up to two decimals. Empty for 2015, the first year. |
| revenueGrowthPct | Revenue growth on prior year (%) | number | % | Computed by Deploi, not a Shopify statement: total revenue divided by the previous fiscal year's total revenue, minus 1, times 100, rounded half up to two decimals. Empty for 2015. Revenue for 2015 to 2022 includes the logistics businesses Shopify sold in 2023. |
| revenueShareOfGmvPct | Revenue as a share of GMV (%) | number | % | Computed by Deploi, not a Shopify statement: total revenue divided by GMV, times 100, rounded half up to two decimals. Revenue includes subscriptions, payments and other services, so this is an average across all merchants and not a fee rate. |
| notes | Row notes | string | Row-specific restatements, rounding differences and comparability warnings. |
The data
| Row key | Fiscal year | GMV (USD million) | Total revenue (USD million) | Subscription Solutions revenue (USD million) | Merchant Solutions revenue (USD million) | MRR at December 31 (USD million) | GPV (USD million) | Shopify Payments penetration (% of GMV) | GMV growth on prior year (%) | Revenue growth on prior year (%) | Revenue as a share of GMV (%) | Row notes |
|---|---|---|---|---|---|---|---|---|---|---|---|---|
| 2015 | 2015 | 7,706.661 | 205.233 | 111.979 | 93.254 | 11.335 | 2,700 | 35 | Not stated | Not stated | 2.66 | First row of the series. GPV and penetration for 2015 appear only as comparatives in the Q4 2016 results release; the Q4 2015 release gave no GPV. |
| 2016 | 2016 | 15,374.166 | 389.33 | 188.606 | 200.724 | 18.461 | 5,900 | 38 | 99.49 | 89.7 | 2.53 | Penetration was first printed as 39% in the Q4 2016 results release and as 38% in the Q4 2017 release (GPV unchanged at $5.9 billion); the published value is the later one. Shopify gives no reason. |
| 2017 | 2017 | 26,320.15 | 673.304 | 310.031 | 363.273 | 29.877 | 10,000 | 38 | 71.2 | 72.94 | 2.56 | |
| 2018 | 2018 | 41,103.238 | 1,073.229 | 464.996 | 608.233 | 40.932 | 16,600 | 40.4 | 56.17 | 59.4 | 2.61 | GMV follows the definition used until the Q3 2019 results ('processed on the Shopify platform'). It was not recast when the wording widened in the Q4 2019 release. Penetration is 40.4% in the FY2019 MD&A and 40% in the results releases. |
| 2019 | 2019 | 61,138.457 | 1,578.173 | 642.241 | 935.932 | 53.898 | 25,700 | 42.1 | 48.74 | 47.05 | 2.58 | GMV follows the widened definition (adds 'certain apps and channels for which a revenue-sharing arrangement is in place'); 2018 was not recast and Shopify does not say how much the new wording adds, so 2018 to 2019 growth is not strictly like for like. |
| 2020 | 2020 | 119,577.147 | 2,929.491 | 908.757 | 2,020.734 | 82.611 | 53,900 | 45.1 | 95.58 | 85.63 | 2.45 | |
| 2021 | 2021 | 175,361.814 | 4,611.856 | 1,342.334 | 3,269.522 | 102.022 | 85,800 | 48.9 | 46.65 | 57.43 | 2.63 | |
| 2022 | 2022 | 197,167 | 5,600 | 1,488 | 4,112 | 109 | 106,100 | 53.8 | 12.43 | 21.43 | 2.84 | Revenue: the FY2022 Form 40-F states 5,599.864, 1,487.759 and 4,112.105 USD million (total, Subscription, Merchant); later filings round these to 5,600, 1,488 and 4,112, which are published here. GMV is 197,166.882 in the FY2022 MD&A and 197,167 in later filings (rounding). MRR at December 31, 2022 was published as $109.5 million (Q4 2022 release; $109.51 million in the FY2022 MD&A table), $110 million in the FY2023 MD&A and $109 million in the FY2024 Form 10-K, the value used here. Shopify does not explain the last change; $109.51 million rounds to $110 million, not $109 million. GPV is $106.1 billion in the filings; the Q4 2023 release table gives 106,066 USD million. |
| 2023 | 2023 | 235,910 | 7,060 | 1,837 | 5,223 | 144 | 137,000 | 58.1 | 19.65 | 26.07 | 2.99 | MRR at December 31, 2023 was first published as $149 million (Q4 2023 release and FY2023 MD&A) and is $144 million after the Q1 2024 revision of how paid trials enter MRR; both Forms 10-K show 144. Revenue includes the logistics businesses only up to their sale in the second quarter of 2023 (the majority sold to Flexport on June 6, 2023), so their revenue stops in that quarter and growth into 2024 is not like for like. GPV is $137.0 billion in the Form 10-K; the Q4 2023 release table gives 137,040 USD million. |
| 2024 | 2024 | 292,275 | 8,880 | 2,350 | 6,530 | 178 | 181,000 | 61.9 | 23.89 | 25.78 | 3.04 | Revenue of the logistics businesses sold in the second quarter of 2023 is in 2023 up to the sale and absent from 2024; growth against 2023 is not like for like (see caveats). |
| 2025 | 2025 | 378,441 | 11,556 | 2,752 | 8,804 | 205 | 248,100 | 65.6 | 29.48 | 30.14 | 3.05 | MRR definition reworded in the Q2 2025 results release; the December 31, 2023 and 2024 values did not change (144 and 178 in both Forms 10-K). |
Where each value comes from
Every value, the document it was read from, the exact place in it and the date it was read. Computed values show their formula.
Show all 205 traced values
| Row | Field | Value | Source | Where in the source | Read on | Method |
|---|---|---|---|---|---|---|
| 2015 | Total revenue (USD million) | 205.233 USD million | SEC EDGAR XBRL companyfacts API, Shopify Inc. (CIK 0001594805) | SalesRevenueServicesNet = 205233000 USD; 2015-01-01 to 2015-12-31; SEC companyfacts API, 40-F filed 2017-02-15Formula: 205,233,000 USD / 1,000,000 = 205.233 USD million | xbrl-api | |
| 2015 | Total revenue (USD million) | 205.233 USD million | Shopify Inc., management's discussion and analysis for FY2016 (Exhibit to Form 40-F), filed 2017-02-15 | …solutions | $ | 188,606 | $ | 111,979 | $ | 66,668 Merchant solutions | 200,724 | 93,254 | 38,350 389,330 | 205,233 | 105,018 | html | |
| 2015 | Subscription Solutions revenue (USD million) | 111.979 USD million | SEC EDGAR XBRL companyfacts API, Shopify Inc. (CIK 0001594805) | LicenseAndServicesRevenue = 111979000 USD; 2015-01-01 to 2015-12-31; SEC companyfacts API, 40-F filed 2017-02-15 | xbrl-api | |
| 2015 | Subscription Solutions revenue (USD million) | 111.979 USD million | Shopify Inc., management's discussion and analysis for FY2016 (Exhibit to Form 40-F), filed 2017-02-15 | …data) Revenues: Subscription solutions | $ | 188,606 | $ | 111,979 | $ | 66,668 Merchant solutions | 200,724 | 93,254 | 38,350… | html | |
| 2015 | Merchant Solutions revenue (USD million) | 93.254 USD million | SEC EDGAR XBRL companyfacts API, Shopify Inc. (CIK 0001594805) | SalesRevenueServicesGross = 93254000 USD; 2015-01-01 to 2015-12-31; SEC companyfacts API, 40-F filed 2017-02-15 | xbrl-api | |
| 2015 | Merchant Solutions revenue (USD million) | 93.254 USD million | Shopify Inc., management's discussion and analysis for FY2016 (Exhibit to Form 40-F), filed 2017-02-15 | …solutions | $ | 188,606 | $ | 111,979 | $ | 66,668 Merchant solutions | 200,724 | 93,254 | 38,350 389,330 | 205,233 | 105,018 | html | |
| 2015 | GMV (USD million) | 7,706.661 USD million | Shopify Inc., management's discussion and analysis for FY2016 (Exhibit to Form 40-F), filed 2017-02-15 | …2016 | 2015 (in thousands) Monthly Recurring Revenue | $ | 18,461 | $ | 11,335 Gross Merchandise Volume | $ | 15,374,166 | $ | 7,706,661 | html | |
| 2015 | MRR at December 31 (USD million) | 11.335 USD million | Shopify Inc., management's discussion and analysis for FY2016 (Exhibit to Form 40-F), filed 2017-02-15 | …2016 | 2015 (in thousands) Monthly Recurring Revenue | $ | 18,461 | $ | 11,335 Gross Merchandise Volume | $ | 15,374,166 | $ | 7,706,661 | html | |
| 2015 | GMV (USD million) | 7,706.661 USD million | Shopify Inc., Q4 and full-year 2015 results press release (Form 6-K, main document), filed 2016-02-17 | Gross Merchandise Volume 2 ("GMV") for 2015 was $7.7 billion, a 105% increase over 2014.Formula: round(7706.661 / 1,000, 1) = 7.7 USD billion (the release states GMV in billions to one decimal; the exact figure is in the KPI table above) | html | |
| 2015 | MRR at December 31 (USD million) | 11.3 USD million | Shopify Inc., Q4 and full-year 2015 results press release (Form 6-K, main document), filed 2016-02-17 | Monthly Recurring Revenue 1 ("MRR") as of December 31, 2015 was $11.3 million, up 72% compared with $6.6 million on December 31, 2014. | html | |
| 2015 | GPV (USD million) | 2,700 USD million | Shopify Inc., Q4 and full-year 2016 results press release (Form 6-K, Exhibit 99.1), filed 2017-02-15 | GPV grew to $5.9 billion in 2016, or 39% of GMV, versus $2.7 billion, or 35% of GMV, for 2015.Formula: $2.7 billion x 1,000 = 2700 USD million (the filing rounds GPV to $0.1 billion) | html | |
| 2015 | Shopify Payments penetration (% of GMV) | 35 % of GMV | Shopify Inc., Q4 and full-year 2016 results press release (Form 6-K, Exhibit 99.1), filed 2017-02-15 | Same passage as GPV (USD million) | html | |
| 2016 | Total revenue (USD million) | 389.33 USD million | SEC EDGAR XBRL companyfacts API, Shopify Inc. (CIK 0001594805) | SalesRevenueServicesNet = 389330000 USD; 2016-01-01 to 2016-12-31; SEC companyfacts API, 40-F filed 2018-02-15Formula: 389,330,000 USD / 1,000,000 = 389.33 USD million | xbrl-api | |
| 2016 | Total revenue (USD million) | 389.33 USD million | Shopify Inc., management's discussion and analysis for FY2017 (Exhibit to Form 40-F), filed 2018-02-15 | …solutions | $ | 310,031 | $ | 188,606 | $ | 111,979 Merchant solutions | 363,273 | 200,724 | 93,254 673,304 | 389,330 | 205,233 | html | |
| 2016 | Subscription Solutions revenue (USD million) | 188.606 USD million | SEC EDGAR XBRL companyfacts API, Shopify Inc. (CIK 0001594805) | LicenseAndServicesRevenue = 188606000 USD; 2016-01-01 to 2016-12-31; SEC companyfacts API, 40-F filed 2018-02-15 | xbrl-api | |
| 2016 | Subscription Solutions revenue (USD million) | 188.606 USD million | Shopify Inc., management's discussion and analysis for FY2017 (Exhibit to Form 40-F), filed 2018-02-15 | …data) Revenues: Subscription solutions | $ | 310,031 | $ | 188,606 | $ | 111,979 Merchant solutions | 363,273 | 200,724 | 93,254… | html | |
| 2016 | Merchant Solutions revenue (USD million) | 200.724 USD million | SEC EDGAR XBRL companyfacts API, Shopify Inc. (CIK 0001594805) | SalesRevenueServicesGross = 200724000 USD; 2016-01-01 to 2016-12-31; SEC companyfacts API, 40-F filed 2018-02-15 | xbrl-api | |
| 2016 | Merchant Solutions revenue (USD million) | 200.724 USD million | Shopify Inc., management's discussion and analysis for FY2017 (Exhibit to Form 40-F), filed 2018-02-15 | …solutions | $ | 310,031 | $ | 188,606 | $ | 111,979 Merchant solutions | 363,273 | 200,724 | 93,254 673,304 | 389,330 | 205,233 | html | |
| 2016 | GMV (USD million) | 15,374.166 USD million | Shopify Inc., management's discussion and analysis for FY2017 (Exhibit to Form 40-F), filed 2018-02-15 | …2017 | 2016 (in thousands) Monthly Recurring Revenue | $ | 29,877 | $ | 18,461 Gross Merchandise Volume | $ | 26,320,150 | $ | 15,374,166 | html | |
| 2016 | MRR at December 31 (USD million) | 18.461 USD million | Shopify Inc., management's discussion and analysis for FY2017 (Exhibit to Form 40-F), filed 2018-02-15 | …2017 | 2016 (in thousands) Monthly Recurring Revenue | $ | 29,877 | $ | 18,461 Gross Merchandise Volume | $ | 26,320,150 | $ | 15,374,166 | html | |
| 2016 | GMV (USD million) | 15,374.166 USD million | Shopify Inc., Q4 and full-year 2016 results press release (Form 6-K, Exhibit 99.1), filed 2017-02-15 | GMV for 2016 was $15.4 billion, an increase of 99% over 2015. GPV grew to $5.9 billion in 2016, or 39% of GMV, versus $2.7 billion, or 35%… | html | |
| 2016 | MRR at December 31 (USD million) | 18.5 USD million | Shopify Inc., Q4 and full-year 2016 results press release (Form 6-K, Exhibit 99.1), filed 2017-02-15 | MRR as of December 31, 2016 was $18.5 million, up 63% compared with $11.3 million as of December 31, 2015. | html | |
| 2016 | GPV (USD million) | 5,900 USD million | Shopify Inc., Q4 and full-year 2017 results press release (Form 6-K, Exhibit 99.1), filed 2018-02-15 | GPV 3 grew to $10.0 billion, which accounted for 38% of GMV processed versus $5.9 billion, or 38%, for 2016.Formula: $5.9 billion x 1,000 = 5900 USD million (the filing rounds GPV to $0.1 billion) | html | |
| 2016 | Shopify Payments penetration (% of GMV) | 38 % of GMV | Shopify Inc., Q4 and full-year 2017 results press release (Form 6-K, Exhibit 99.1), filed 2018-02-15 | Same passage as GPV (USD million) | html | |
| 2016 | GPV (USD million) | 5,900 USD million | Shopify Inc., Q4 and full-year 2016 results press release (Form 6-K, Exhibit 99.1), filed 2017-02-15 | …was $15.4 billion, an increase of 99% over 2015. GPV grew to $5.9 billion in 2016, or 39% of GMV, versus $2.7 billion, or 35% of… | html | |
| 2016 | Shopify Payments penetration (% of GMV) | 39 % of GMV | Shopify Inc., Q4 and full-year 2016 results press release (Form 6-K, Exhibit 99.1), filed 2017-02-15 | …billion, an increase of 99% over 2015. GPV grew to $5.9 billion in 2016, or 39% of GMV, versus $2.7 billion, or 35% of GMV, for 2015. | html | |
| 2017 | Total revenue (USD million) | 673.304 USD million | SEC EDGAR XBRL companyfacts API, Shopify Inc. (CIK 0001594805) | RevenueFromContractWithCustomerExcludingAssessedTax = 673304000 USD; 2017-01-01 to 2017-12-31; SEC companyfacts API, 40-F filed 2019-02-12 | xbrl-api | |
| 2017 | Total revenue (USD million) | 673.304 USD million | Shopify Inc., management's discussion and analysis for FY2018 (Exhibit to Form 40-F), filed 2019-02-12 | …solutions | $ | 464,996 | $ | 310,031 | $ | 188,606 Merchant solutions | 608,233 | 363,273 | 200,724 1,073,229 | 673,304 | 389,330 | html | |
| 2017 | Subscription Solutions revenue (USD million) | 310.031 USD million | Shopify Inc., XBRL instance document shop-20181231.xml of Form 40-F, filed 2019-02-12 | RevenueFromContractWithCustomerExcludingAssessedTax = 310031000 USD; 2017-01-01 to 2017-12-31; SubscriptionAndCirculationMember; XBRL, 40-F filed 2019-02-12 | xbrl-api | |
| 2017 | Subscription Solutions revenue (USD million) | 310.031 USD million | Shopify Inc., management's discussion and analysis for FY2018 (Exhibit to Form 40-F), filed 2019-02-12 | …data) Revenues: Subscription solutions | $ | 464,996 | $ | 310,031 | $ | 188,606 Merchant solutions | 608,233 | 363,273 | 200,724… | html | |
| 2017 | Merchant Solutions revenue (USD million) | 363.273 USD million | Shopify Inc., XBRL instance document shop-20181231.xml of Form 40-F, filed 2019-02-12 | RevenueFromContractWithCustomerExcludingAssessedTax = 363273000 USD; 2017-01-01 to 2017-12-31; ServiceMember; XBRL, 40-F filed 2019-02-12 | xbrl-api | |
| 2017 | Merchant Solutions revenue (USD million) | 363.273 USD million | Shopify Inc., management's discussion and analysis for FY2018 (Exhibit to Form 40-F), filed 2019-02-12 | …solutions | $ | 464,996 | $ | 310,031 | $ | 188,606 Merchant solutions | 608,233 | 363,273 | 200,724 1,073,229 | 673,304 | 389,330 | html | |
| 2017 | GMV (USD million) | 26,320.15 USD million | Shopify Inc., management's discussion and analysis for FY2018 (Exhibit to Form 40-F), filed 2019-02-12 | …2018 | 2017 (in thousands) Monthly Recurring Revenue | $ | 40,932 | $ | 29,877 Gross Merchandise Volume | $ | 41,103,238 | $ | 26,320,150 | html | |
| 2017 | MRR at December 31 (USD million) | 29.877 USD million | Shopify Inc., management's discussion and analysis for FY2018 (Exhibit to Form 40-F), filed 2019-02-12 | …2018 | 2017 (in thousands) Monthly Recurring Revenue | $ | 40,932 | $ | 29,877 Gross Merchandise Volume | $ | 41,103,238 | $ | 26,320,150 | html | |
| 2017 | GMV (USD million) | 26,320.15 USD million | Shopify Inc., Q4 and full-year 2017 results press release (Form 6-K, Exhibit 99.1), filed 2018-02-15 | GMV 2 for 2017 was $26.3 billion, an increase of 71% over 2016. GPV 3 grew to $10.0 billion, which accounted for 38% of GMV processed… | html | |
| 2017 | MRR at December 31 (USD million) | 29.9 USD million | Shopify Inc., Q4 and full-year 2017 results press release (Form 6-K, Exhibit 99.1), filed 2018-02-15 | MRR as of December 31, 2017 was $29.9 million, up 62% compared with $18.5 million as of December 31, 2016. | html | |
| 2017 | GPV (USD million) | 10,000 USD million | Shopify Inc., Q4 and full-year 2018 results press release (Form 6-K, Exhibit 99.1), filed 2019-02-12 | GPV 3 grew to $16.6 billion, which accounted for 40% of GMV processed versus $10.0 billion, or 38%, for 2017.Formula: $10.0 billion x 1,000 = 10000 USD million (the filing rounds GPV to $0.1 billion) | html | |
| 2017 | Shopify Payments penetration (% of GMV) | 38 % of GMV | Shopify Inc., Q4 and full-year 2018 results press release (Form 6-K, Exhibit 99.1), filed 2019-02-12 | Same passage as GPV (USD million) | html | |
| 2017 | GPV (USD million) | 10,000 USD million | Shopify Inc., Q4 and full-year 2017 results press release (Form 6-K, Exhibit 99.1), filed 2018-02-15 | …was $26.3 billion, an increase of 71% over 2016. GPV 3 grew to $10.0 billion, which accounted for 38% of GMV processed versus $5.9… | html | |
| 2017 | Shopify Payments penetration (% of GMV) | 38 % of GMV | Shopify Inc., Q4 and full-year 2017 results press release (Form 6-K, Exhibit 99.1), filed 2018-02-15 | …increase of 71% over 2016. GPV 3 grew to $10.0 billion, which accounted for 38% of GMV processed versus $5.9 billion, or 38%, for 2016. | html | |
| 2018 | Total revenue (USD million) | 1,073.229 USD million | SEC EDGAR XBRL companyfacts API, Shopify Inc. (CIK 0001594805) | RevenueFromContractWithCustomerExcludingAssessedTax = 1073229000 USD; 2018-01-01 to 2018-12-31; SEC companyfacts API, 40-F filed 2020-02-12 | xbrl-api | |
| 2018 | Total revenue (USD million) | 1,073.229 USD million | Shopify Inc., management's discussion and analysis for FY2019 (Exhibit to Form 40-F), filed 2020-02-12 | …solutions | $ | 642,241 | $ | 464,996 | $ | 310,031 Merchant solutions | 935,932 | 608,233 | 363,273 1,578,173 | 1,073,229 | 673,304 | html | |
| 2018 | Subscription Solutions revenue (USD million) | 464.996 USD million | Shopify Inc., XBRL instance document form40-f2019_htm.xml of Form 40-F, filed 2020-02-12 | RevenueFromContractWithCustomerExcludingAssessedTax = 464996000 USD; 2018-01-01 to 2018-12-31; SubscriptionAndCirculationMember; XBRL, 40-F filed 2020-02-12 | xbrl-api | |
| 2018 | Subscription Solutions revenue (USD million) | 464.996 USD million | Shopify Inc., management's discussion and analysis for FY2019 (Exhibit to Form 40-F), filed 2020-02-12 | …data) Revenues: Subscription solutions | $ | 642,241 | $ | 464,996 | $ | 310,031 Merchant solutions | 935,932 | 608,233 | 363,273… | html | |
| 2018 | Merchant Solutions revenue (USD million) | 608.233 USD million | Shopify Inc., XBRL instance document form40-f2019_htm.xml of Form 40-F, filed 2020-02-12 | RevenueFromContractWithCustomerExcludingAssessedTax = 608233000 USD; 2018-01-01 to 2018-12-31; ServiceMember; XBRL, 40-F filed 2020-02-12 | xbrl-api | |
| 2018 | Merchant Solutions revenue (USD million) | 608.233 USD million | Shopify Inc., management's discussion and analysis for FY2019 (Exhibit to Form 40-F), filed 2020-02-12 | …solutions | $ | 642,241 | $ | 464,996 | $ | 310,031 Merchant solutions | 935,932 | 608,233 | 363,273 1,578,173 | 1,073,229 | 673,304 | html | |
| 2018 | GMV (USD million) | 41,103.238 USD million | Shopify Inc., management's discussion and analysis for FY2019 (Exhibit to Form 40-F), filed 2020-02-12 | …2019 | 2018 (in thousands) Monthly Recurring Revenue | $ | 53,898 | $ | 40,932 Gross Merchandise Volume | $ | 61,138,457 | $ | 41,103,238 | html | |
| 2018 | MRR at December 31 (USD million) | 40.932 USD million | Shopify Inc., management's discussion and analysis for FY2019 (Exhibit to Form 40-F), filed 2020-02-12 | …2019 | 2018 (in thousands) Monthly Recurring Revenue | $ | 53,898 | $ | 40,932 Gross Merchandise Volume | $ | 61,138,457 | $ | 41,103,238 | html | |
| 2018 | GMV (USD million) | 41,103.238 USD million | Shopify Inc., Q4 and full-year 2018 results press release (Form 6-K, Exhibit 99.1), filed 2019-02-12 | GMV 2 for 2018 was $41.1 billion, an increase of 56% over 2017. GPV 3 grew to $16.6 billion, which accounted for 40% of GMV processed… | html | |
| 2018 | MRR at December 31 (USD million) | 40.9 USD million | Shopify Inc., Q4 and full-year 2018 results press release (Form 6-K, Exhibit 99.1), filed 2019-02-12 | MRR as of December 31, 2018 was $40.9 million, up 37% compared with $29.9 million as of December 31, 2017. | html | |
| 2018 | GPV (USD million) | 16,600 USD million | Shopify Inc., management's discussion and analysis for FY2019 (Exhibit to Form 40-F), filed 2020-02-12 | This compares to a penetration rate of 40.4%, resulting in GMV of $16.6 billion that was facilitated using Shopify Payments in the same… | html | |
| 2018 | Shopify Payments penetration (% of GMV) | 40.4 % of GMV | Shopify Inc., management's discussion and analysis for FY2019 (Exhibit to Form 40-F), filed 2020-02-12 | This compares to a penetration rate of 40.4%, resulting in GMV of $16.6 billion that was facilitated using Shopify Payments in the same… | html | |
| 2018 | GPV (USD million) | 16,600 USD million | Shopify Inc., Q4 and full-year 2018 results press release (Form 6-K, Exhibit 99.1), filed 2019-02-12 | …was $41.1 billion, an increase of 56% over 2017. GPV 3 grew to $16.6 billion, which accounted for 40% of GMV processed versus $10.0… | html | |
| 2018 | Shopify Payments penetration (% of GMV) | 40 % of GMV | Shopify Inc., Q4 and full-year 2018 results press release (Form 6-K, Exhibit 99.1), filed 2019-02-12 | …increase of 56% over 2017. GPV 3 grew to $16.6 billion, which accounted for 40% of GMV processed versus $10.0 billion, or 38%, for 2017. | html | |
| 2019 | Total revenue (USD million) | 1,578.173 USD million | SEC EDGAR XBRL companyfacts API, Shopify Inc. (CIK 0001594805) | RevenueFromContractWithCustomerExcludingAssessedTax = 1578173000 USD; 2019-01-01 to 2019-12-31; SEC companyfacts API, 40-F filed 2021-02-17 | xbrl-api | |
| 2019 | Total revenue (USD million) | 1,578.173 USD million | Shopify Inc., management's discussion and analysis for FY2020 (Exhibit to Form 40-F), filed 2021-02-17 | …solutions | $ | 908,757 | $ | 642,241 | $ | 464,996 Merchant solutions | 2,020,734 | 935,932 | 608,233 2,929,491 | 1,578,173 | 1,073,229 | html | |
| 2019 | Subscription Solutions revenue (USD million) | 642.241 USD million | Shopify Inc., XBRL instance document shop-20201231_htm.xml of Form 40-F, filed 2021-02-17 | RevenueFromContractWithCustomerExcludingAssessedTax = 642241000 USD; 2019-01-01 to 2019-12-31; SubscriptionAndCirculationMember; XBRL, 40-F filed 2021-02-17 | xbrl-api | |
| 2019 | Subscription Solutions revenue (USD million) | 642.241 USD million | Shopify Inc., management's discussion and analysis for FY2020 (Exhibit to Form 40-F), filed 2021-02-17 | …data) Revenues: Subscription solutions | $ | 908,757 | $ | 642,241 | $ | 464,996 Merchant solutions | 2,020,734 | 935,932 | 608,233… | html | |
| 2019 | Merchant Solutions revenue (USD million) | 935.932 USD million | Shopify Inc., XBRL instance document shop-20201231_htm.xml of Form 40-F, filed 2021-02-17 | RevenueFromContractWithCustomerExcludingAssessedTax = 935932000 USD; 2019-01-01 to 2019-12-31; ServiceMember; XBRL, 40-F filed 2021-02-17 | xbrl-api | |
| 2019 | Merchant Solutions revenue (USD million) | 935.932 USD million | Shopify Inc., management's discussion and analysis for FY2020 (Exhibit to Form 40-F), filed 2021-02-17 | …solutions | $ | 908,757 | $ | 642,241 | $ | 464,996 Merchant solutions | 2,020,734 | 935,932 | 608,233 2,929,491 | 1,578,173 | 1,073,229 | html | |
| 2019 | GMV (USD million) | 61,138.457 USD million | Shopify Inc., management's discussion and analysis for FY2020 (Exhibit to Form 40-F), filed 2021-02-17 | …| 2019 (in thousands) Monthly Recurring Revenue | $ | 82,611 | $ | 53,898 Gross Merchandise Volume | $ | 119,577,147 | $ | 61,138,457 | html | |
| 2019 | MRR at December 31 (USD million) | 53.898 USD million | Shopify Inc., management's discussion and analysis for FY2020 (Exhibit to Form 40-F), filed 2021-02-17 | …| 2019 (in thousands) Monthly Recurring Revenue | $ | 82,611 | $ | 53,898 Gross Merchandise Volume | $ | 119,577,147 | $ | 61,138,457 | html | |
| 2019 | GMV (USD million) | 61,138.457 USD million | Shopify Inc., Q4 and full-year 2019 results press release (Form 6-K, Exhibit 99.1), filed 2020-02-12 | GMV 2 for 2019 was $61.1 billion, an increase of 49% over 2018. GPV 3 grew to $25.7 billion, which accounted for 42% of GMV processed… | html | |
| 2019 | MRR at December 31 (USD million) | 53.9 USD million | Shopify Inc., Q4 and full-year 2019 results press release (Form 6-K, Exhibit 99.1), filed 2020-02-12 | MRR as of December 31, 2019 was $53.9 million, up 32% compared with $40.9 million as of December 31, 2018. | html | |
| 2019 | GPV (USD million) | 25,700 USD million | Shopify Inc., management's discussion and analysis for FY2020 (Exhibit to Form 40-F), filed 2021-02-17 | This compares to a penetration rate of 42.1%, resulting in GMV of $25.7 billion that was facilitated using Shopify Payments in the same… | html | |
| 2019 | Shopify Payments penetration (% of GMV) | 42.1 % of GMV | Shopify Inc., management's discussion and analysis for FY2020 (Exhibit to Form 40-F), filed 2021-02-17 | This compares to a penetration rate of 42.1%, resulting in GMV of $25.7 billion that was facilitated using Shopify Payments in the same… | html | |
| 2019 | GPV (USD million) | 25,700 USD million | Shopify Inc., management's discussion and analysis for FY2019 (Exhibit to Form 40-F), filed 2020-02-12 | …31, 2019, the Shopify Payments penetration rate was 42.1%, resulting in GMV of $25.7 billion that was facilitated using Shopify Payments. | html | |
| 2019 | Shopify Payments penetration (% of GMV) | 42.1 % of GMV | Shopify Inc., management's discussion and analysis for FY2019 (Exhibit to Form 40-F), filed 2020-02-12 | …December 31, 2019, the Shopify Payments penetration rate was 42.1%, resulting in GMV of $25.7 billion that was facilitated using… | html | |
| 2019 | GPV (USD million) | 25,700 USD million | Shopify Inc., Q4 and full-year 2019 results press release (Form 6-K, Exhibit 99.1), filed 2020-02-12 | …was $61.1 billion, an increase of 49% over 2018. GPV 3 grew to $25.7 billion, which accounted for 42% of GMV processed versus $16.6… | html | |
| 2019 | Shopify Payments penetration (% of GMV) | 42 % of GMV | Shopify Inc., Q4 and full-year 2019 results press release (Form 6-K, Exhibit 99.1), filed 2020-02-12 | …increase of 49% over 2018. GPV 3 grew to $25.7 billion, which accounted for 42% of GMV processed versus $16.6 billion, or 40%, for 2018. | html | |
| 2020 | Total revenue (USD million) | 2,929.491 USD million | SEC EDGAR XBRL companyfacts API, Shopify Inc. (CIK 0001594805) | RevenueFromContractWithCustomerExcludingAssessedTax = 2929491000 USD; 2020-01-01 to 2020-12-31; SEC companyfacts API, 40-F filed 2022-02-16 | xbrl-api | |
| 2020 | Total revenue (USD million) | 2,929.491 USD million | Shopify Inc., management's discussion and analysis for FY2021 (Exhibit to Form 40-F), filed 2022-02-16 | …| $ | 1,342,334 | $ | 908,757 | $ | 642,241 Merchant solutions | 3,269,522 | 2,020,734 | 935,932 4,611,856 | 2,929,491 | 1,578,173 | html | |
| 2020 | Subscription Solutions revenue (USD million) | 908.757 USD million | Shopify Inc., XBRL instance document shop-20211231_htm.xml of Form 40-F, filed 2022-02-16 | RevenueFromContractWithCustomerExcludingAssessedTax = 908757000 USD; 2020-01-01 to 2020-12-31; SubscriptionAndCirculationMember; XBRL, 40-F filed 2022-02-16 | xbrl-api | |
| 2020 | Subscription Solutions revenue (USD million) | 908.757 USD million | Shopify Inc., management's discussion and analysis for FY2021 (Exhibit to Form 40-F), filed 2022-02-16 | …data) Revenues: Subscription solutions | $ | 1,342,334 | $ | 908,757 | $ | 642,241 Merchant solutions | 3,269,522 | 2,020,734 |… | html | |
| 2020 | Merchant Solutions revenue (USD million) | 2,020.734 USD million | Shopify Inc., XBRL instance document shop-20211231_htm.xml of Form 40-F, filed 2022-02-16 | RevenueFromContractWithCustomerExcludingAssessedTax = 2020734000 USD; 2020-01-01 to 2020-12-31; ServiceMember; XBRL, 40-F filed 2022-02-16 | xbrl-api | |
| 2020 | Merchant Solutions revenue (USD million) | 2,020.734 USD million | Shopify Inc., management's discussion and analysis for FY2021 (Exhibit to Form 40-F), filed 2022-02-16 | …| $ | 1,342,334 | $ | 908,757 | $ | 642,241 Merchant solutions | 3,269,522 | 2,020,734 | 935,932 4,611,856 | 2,929,491 | 1,578,173 | html | |
| 2020 | GMV (USD million) | 119,577.147 USD million | Shopify Inc., management's discussion and analysis for FY2021 (Exhibit to Form 40-F), filed 2022-02-16 | …| 2020 (in thousands) Monthly Recurring Revenue | $ | 102,022 | $ | 82,611 Gross Merchandise Volume | $ | 175,361,814 | $ | 119,577,147 | html | |
| 2020 | MRR at December 31 (USD million) | 82.611 USD million | Shopify Inc., management's discussion and analysis for FY2021 (Exhibit to Form 40-F), filed 2022-02-16 | …| 2020 (in thousands) Monthly Recurring Revenue | $ | 102,022 | $ | 82,611 Gross Merchandise Volume | $ | 175,361,814 | $ | 119,577,147 | html | |
| 2020 | GMV (USD million) | 119,577.147 USD million | Shopify Inc., Q4 and full-year 2020 results press release (Form 6-K, Exhibit 99.1), filed 2021-02-17 | GMV 1 for 2020 was $119.6 billion, an increase of 96% over 2019. GPV 3 grew to $53.9 billion, which accounted for 45% of GMV processed… | html | |
| 2020 | MRR at December 31 (USD million) | 82.6 USD million | Shopify Inc., Q4 and full-year 2020 results press release (Form 6-K, Exhibit 99.1), filed 2021-02-17 | Monthly Recurring Revenue 2 ("MRR") as of December 31, 2020 was $82.6 million. | html | |
| 2020 | GPV (USD million) | 53,900 USD million | Shopify Inc., management's discussion and analysis for FY2021 (Exhibit to Form 40-F), filed 2022-02-16 | This compares to a penetration rate of 45.1%, resulting in GMV of $53.9 billion that was facilitated using Shopify Payments in the same… | html | |
| 2020 | Shopify Payments penetration (% of GMV) | 45.1 % of GMV | Shopify Inc., management's discussion and analysis for FY2021 (Exhibit to Form 40-F), filed 2022-02-16 | This compares to a penetration rate of 45.1%, resulting in GMV of $53.9 billion that was facilitated using Shopify Payments in the same… | html | |
| 2020 | GPV (USD million) | 53,900 USD million | Shopify Inc., management's discussion and analysis for FY2020 (Exhibit to Form 40-F), filed 2021-02-17 | …31, 2020, the Shopify Payments penetration rate was 45.1%, resulting in GMV of $53.9 billion that was facilitated using Shopify Payments. | html | |
| 2020 | Shopify Payments penetration (% of GMV) | 45.1 % of GMV | Shopify Inc., management's discussion and analysis for FY2020 (Exhibit to Form 40-F), filed 2021-02-17 | …December 31, 2020, the Shopify Payments penetration rate was 45.1%, resulting in GMV of $53.9 billion that was facilitated using… | html | |
| 2020 | GPV (USD million) | 53,900 USD million | Shopify Inc., Q4 and full-year 2020 results press release (Form 6-K, Exhibit 99.1), filed 2021-02-17 | …was $119.6 billion, an increase of 96% over 2019. GPV 3 grew to $53.9 billion, which accounted for 45% of GMV processed versus $25.7… | html | |
| 2020 | Shopify Payments penetration (% of GMV) | 45 % of GMV | Shopify Inc., Q4 and full-year 2020 results press release (Form 6-K, Exhibit 99.1), filed 2021-02-17 | …increase of 96% over 2019. GPV 3 grew to $53.9 billion, which accounted for 45% of GMV processed versus $25.7 billion, or 42%, for 2019. | html | |
| 2021 | Total revenue (USD million) | 4,611.856 USD million | SEC EDGAR XBRL companyfacts API, Shopify Inc. (CIK 0001594805) | RevenueFromContractWithCustomerExcludingAssessedTax = 4611856000 USD; 2021-01-01 to 2021-12-31; SEC companyfacts API, 40-F filed 2023-02-16 | xbrl-api | |
| 2021 | Total revenue (USD million) | 4,611.856 USD million | Shopify Inc., management's discussion and analysis for FY2022 (Exhibit to Form 40-F), filed 2023-02-16 | …| $ | 1,487,759 | $ | 1,342,334 | $ | 908,757 Merchant solutions | 4,112,105 | 3,269,522 | 2,020,734 5,599,864 | 4,611,856 | 2,929,491 | html | |
| 2021 | Subscription Solutions revenue (USD million) | 1,342.334 USD million | Shopify Inc., XBRL instance document shop-20221231_htm.xml of Form 40-F, filed 2023-02-16 | RevenueFromContractWithCustomerExcludingAssessedTax = 1342334000 USD; 2021-01-01 to 2021-12-31; SubscriptionAndCirculationMember; XBRL, 40-F filed 2023-02-16 | xbrl-api | |
| 2021 | Subscription Solutions revenue (USD million) | 1,342.334 USD million | Shopify Inc., management's discussion and analysis for FY2022 (Exhibit to Form 40-F), filed 2023-02-16 | …data) Revenues: Subscription solutions | $ | 1,487,759 | $ | 1,342,334 | $ | 908,757 Merchant solutions | 4,112,105 | 3,269,522 |… | html | |
| 2021 | Merchant Solutions revenue (USD million) | 3,269.522 USD million | Shopify Inc., XBRL instance document shop-20221231_htm.xml of Form 40-F, filed 2023-02-16 | RevenueFromContractWithCustomerExcludingAssessedTax = 3269522000 USD; 2021-01-01 to 2021-12-31; ServiceMember; XBRL, 40-F filed 2023-02-16 | xbrl-api | |
| 2021 | Merchant Solutions revenue (USD million) | 3,269.522 USD million | Shopify Inc., management's discussion and analysis for FY2022 (Exhibit to Form 40-F), filed 2023-02-16 | …| $ | 1,487,759 | $ | 1,342,334 | $ | 908,757 Merchant solutions | 4,112,105 | 3,269,522 | 2,020,734 5,599,864 | 4,611,856 | 2,929,491 | html | |
| 2021 | GMV (USD million) | 175,361.814 USD million | Shopify Inc., management's discussion and analysis for FY2022 (Exhibit to Form 40-F), filed 2023-02-16 | …| 2021 (in thousands) Monthly Recurring Revenue | $ | 109,510 | $ | 102,022 Gross Merchandise Volume | $ | 197,166,882 | $ | 175,361,814 | html | |
| 2021 | MRR at December 31 (USD million) | 102.022 USD million | Shopify Inc., management's discussion and analysis for FY2022 (Exhibit to Form 40-F), filed 2023-02-16 | …| 2021 (in thousands) Monthly Recurring Revenue | $ | 109,510 | $ | 102,022 Gross Merchandise Volume | $ | 197,166,882 | $ | 175,361,814 | html | |
| 2021 | GMV (USD million) | 175,361.814 USD million | Shopify Inc., Q4 and full-year 2021 results press release (Form 6-K, Exhibit 99.1), filed 2022-02-16 | GMV 1 for 2021 was $175.4 billion, an increase of 47% over 2020. GPV 3 grew to $85.8 billion, which accounted for 49% of GMV processed… | html | |
| 2021 | MRR at December 31 (USD million) | 102 USD million | Shopify Inc., Q4 and full-year 2021 results press release (Form 6-K, Exhibit 99.1), filed 2022-02-16 | Monthly Recurring Revenue 2 ("MRR") as of December 31, 2021 was $102.0 million, surpassing $100 million for the first time. MRR increased… | html | |
| 2021 | GPV (USD million) | 85,800 USD million | Shopify Inc., management's discussion and analysis for FY2022 (Exhibit to Form 40-F), filed 2023-02-16 | This compares to a penetration rate of 48.9%, resulting in GMV of $85.8 billion that was facilitated using Shopify Payments in the same… | html | |
| 2021 | Shopify Payments penetration (% of GMV) | 48.9 % of GMV | Shopify Inc., management's discussion and analysis for FY2022 (Exhibit to Form 40-F), filed 2023-02-16 | This compares to a penetration rate of 48.9%, resulting in GMV of $85.8 billion that was facilitated using Shopify Payments in the same… | html | |
| 2021 | GPV (USD million) | 85,800 USD million | Shopify Inc., management's discussion and analysis for FY2021 (Exhibit to Form 40-F), filed 2022-02-16 | …31, 2021, the Shopify Payments penetration rate was 48.9%, resulting in GMV of $85.8 billion that was facilitated using Shopify Payments. | html | |
| 2021 | Shopify Payments penetration (% of GMV) | 48.9 % of GMV | Shopify Inc., management's discussion and analysis for FY2021 (Exhibit to Form 40-F), filed 2022-02-16 | …December 31, 2021, the Shopify Payments penetration rate was 48.9%, resulting in GMV of $85.8 billion that was facilitated using… | html | |
| 2021 | GPV (USD million) | 85,800 USD million | Shopify Inc., Q4 and full-year 2021 results press release (Form 6-K, Exhibit 99.1), filed 2022-02-16 | …was $175.4 billion, an increase of 47% over 2020. GPV 3 grew to $85.8 billion, which accounted for 49% of GMV processed versus $53.9… | html | |
| 2021 | Shopify Payments penetration (% of GMV) | 49 % of GMV | Shopify Inc., Q4 and full-year 2021 results press release (Form 6-K, Exhibit 99.1), filed 2022-02-16 | …increase of 47% over 2020. GPV 3 grew to $85.8 billion, which accounted for 49% of GMV processed versus $53.9 billion or 45%, for 2020. | html | |
| 2022 | Total revenue (USD million) | 5,600 USD million | SEC EDGAR XBRL companyfacts API, Shopify Inc. (CIK 0001594805) | Revenues = 5600000000 USD; 2022-01-01 to 2022-12-31; SEC companyfacts API, 10-K filed 2025-02-11Formula: 5,600,000,000 USD / 1,000,000 = 5600 USD million | xbrl-api | |
| 2022 | Total revenue (USD million) | 5,600 USD million | Shopify Inc., Form 10-K for the fiscal year ended December 31, 2024, filed 2025-02-11 | …Revenues Subscription solutions | $ | 2,350 | $ | 1,837 | $ | 1,488 Merchant solutions | 6,530 | 5,223 | 4,112 8,880 | 7,060 | 5,600 | html | |
| 2022 | Subscription Solutions revenue (USD million) | 1,488 USD million | Shopify Inc., XBRL instance document shop-20241231_htm.xml of Form 10-K, filed 2025-02-11 | Revenues = 1488000000 USD; 2022-01-01 to 2022-12-31; SubscriptionAndCirculationMember; XBRL, 10-K filed 2025-02-11 | xbrl-api | |
| 2022 | Subscription Solutions revenue (USD million) | 1,488 USD million | Shopify Inc., Form 10-K for the fiscal year ended December 31, 2024, filed 2025-02-11 | …Revenues Subscription solutions | $ | 2,350 | $ | 1,837 | $ | 1,488 Merchant solutions | 6,530 | 5,223 | 4,112 8,880 | 7,060 | 5,600 | html | |
| 2022 | Merchant Solutions revenue (USD million) | 4,112 USD million | Shopify Inc., XBRL instance document shop-20241231_htm.xml of Form 10-K, filed 2025-02-11 | Revenues = 4112000000 USD; 2022-01-01 to 2022-12-31; ServiceMember; XBRL, 10-K filed 2025-02-11Formula: 4,112,000,000 USD / 1,000,000 = 4112 USD million | xbrl-api | |
| 2022 | Merchant Solutions revenue (USD million) | 4,112 USD million | Shopify Inc., Form 10-K for the fiscal year ended December 31, 2024, filed 2025-02-11 | …Revenues Subscription solutions | $ | 2,350 | $ | 1,837 | $ | 1,488 Merchant solutions | 6,530 | 5,223 | 4,112 8,880 | 7,060 | 5,600 | html | |
| 2022 | GMV (USD million) | 197,167 USD million | Shopify Inc., Form 10-K for the fiscal year ended December 31, 2024, filed 2025-02-11 | …2024 | 2023 | 2022 (in US $ millions) Monthly Recurring Revenue | 178 | 144 | 109 Gross Merchandise Volume | 292,275 | 235,910 | 197,167 | html | |
| 2022 | GMV (USD million) | 197,166.882 USD million | Shopify Inc., management's discussion and analysis for FY2022 (Exhibit to Form 40-F), filed 2023-02-16 | …| 2021 (in thousands) Monthly Recurring Revenue | $ | 109,510 | $ | 102,022 Gross Merchandise Volume | $ | 197,166,882 | $ | 175,361,814 | html | |
| 2022 | MRR at December 31 (USD million) | 109 USD million | Shopify Inc., Form 10-K for the fiscal year ended December 31, 2024, filed 2025-02-11 | …2024 | 2023 | 2022 (in US $ millions) Monthly Recurring Revenue | 178 | 144 | 109 Gross Merchandise Volume | 292,275 | 235,910 | 197,167 | html | |
| 2022 | MRR at December 31 (USD million) | 109.51 USD million | Shopify Inc., management's discussion and analysis for FY2022 (Exhibit to Form 40-F), filed 2023-02-16 | …31, 2022 | 2021 (in thousands) Monthly Recurring Revenue | $ | 109,510 | $ | 102,022 Gross Merchandise Volume | $ | 197,166,882 | $ |… | html | |
| 2022 | MRR at December 31 (USD million) | 110 USD million | Shopify Inc., management's discussion and analysis for FY2023 (Exhibit to Form 40-F), filed 2024-02-13 | …2022 (in millions, except percentages) Monthly Recurring Revenue | $ | 149 | $ | 110 Gross Merchandise Volume | $ | 235,910 | $ | 197,167 | html | |
| 2022 | GMV (USD million) | 197,167 USD million | Shopify Inc., Q4 and full-year 2022 results press release (Form 6-K, Exhibit 99.1), filed 2023-02-15 | GMV 1 increased 12% to $197.2 billion, compared to 2021, up 16% on a constant currency basis. GPV 2 grew to $106.1 billion, which… | html | |
| 2022 | MRR at December 31 (USD million) | 109.5 USD million | Shopify Inc., Q4 and full-year 2022 results press release (Form 6-K, Exhibit 99.1), filed 2023-02-15 | Monthly Recurring Revenue 3 ("MRR") as of December 31, 2022 increased 7% to $109.5 million compared to the prior year. | html | |
| 2022 | GPV (USD million) | 106,100 USD million | Shopify Inc., Form 10-K for the fiscal year ended December 31, 2024, filed 2025-02-11 | …compares to a penetration rate of 53.8%, resulting in GMV of $106.1 billion that was facilitated using Shopify Payments in the same… | html | |
| 2022 | Shopify Payments penetration (% of GMV) | 53.8 % of GMV | Shopify Inc., Form 10-K for the fiscal year ended December 31, 2024, filed 2025-02-11 | This compares to a penetration rate of 53.8%, resulting in GMV of $106.1 billion that was facilitated using Shopify Payments in the same… | html | |
| 2022 | GPV (USD million) | 106,100 USD million | Shopify Inc., management's discussion and analysis for FY2022 (Exhibit to Form 40-F), filed 2023-02-16 | …2022, the Shopify Payments penetration rate was 53.8%, resulting in GMV of $106.1 billion that was facilitated using Shopify Payments. | html | |
| 2022 | Shopify Payments penetration (% of GMV) | 53.8 % of GMV | Shopify Inc., management's discussion and analysis for FY2022 (Exhibit to Form 40-F), filed 2023-02-16 | …December 31, 2022, the Shopify Payments penetration rate was 53.8%, resulting in GMV of $106.1 billion that was facilitated using… | html | |
| 2022 | GPV (USD million) | 106,100 USD million | Shopify Inc., Q4 and full-year 2022 results press release (Form 6-K, Exhibit 99.1), filed 2023-02-15 | …to 2021, up 16% on a constant currency basis. GPV 2 grew to $106.1 billion, which accounted for 54% of GMV processed versus $85.8… | html | |
| 2022 | Shopify Payments penetration (% of GMV) | 54 % of GMV | Shopify Inc., Q4 and full-year 2022 results press release (Form 6-K, Exhibit 99.1), filed 2023-02-15 | …a constant currency basis. GPV 2 grew to $106.1 billion, which accounted for 54% of GMV processed versus $85.8 billion or 49%, for 2021. | html | |
| 2023 | Total revenue (USD million) | 7,060 USD million | SEC EDGAR XBRL companyfacts API, Shopify Inc. (CIK 0001594805) | Revenues = 7060000000 USD; 2023-01-01 to 2023-12-31; SEC companyfacts API, 10-K filed 2026-02-11Formula: 7,060,000,000 USD / 1,000,000 = 7060 USD million | xbrl-api | |
| 2023 | Total revenue (USD million) | 7,060 USD million | Shopify Inc., Form 10-K for the fiscal year ended December 31, 2025, filed 2026-02-11 | …share amounts) Revenues Subscription solutions | 2,752 | 2,350 | 1,837 Merchant solutions | 8,804 | 6,530 | 5,223 11,556 | 8,880 | 7,060 | html | |
| 2023 | Subscription Solutions revenue (USD million) | 1,837 USD million | Shopify Inc., XBRL instance document shop-20251231_htm.xml of Form 10-K, filed 2026-02-11 | Revenues = 1837000000 USD; 2023-01-01 to 2023-12-31; SubscriptionAndCirculationMember; XBRL, 10-K filed 2026-02-11 | xbrl-api | |
| 2023 | Subscription Solutions revenue (USD million) | 1,837 USD million | Shopify Inc., Form 10-K for the fiscal year ended December 31, 2025, filed 2026-02-11 | …share amounts) Revenues Subscription solutions | 2,752 | 2,350 | 1,837 Merchant solutions | 8,804 | 6,530 | 5,223 11,556 | 8,880 | 7,060 | html | |
| 2023 | Merchant Solutions revenue (USD million) | 5,223 USD million | Shopify Inc., XBRL instance document shop-20251231_htm.xml of Form 10-K, filed 2026-02-11 | Revenues = 5223000000 USD; 2023-01-01 to 2023-12-31; ServiceMember; XBRL, 10-K filed 2026-02-11Formula: 5,223,000,000 USD / 1,000,000 = 5223 USD million | xbrl-api | |
| 2023 | Merchant Solutions revenue (USD million) | 5,223 USD million | Shopify Inc., Form 10-K for the fiscal year ended December 31, 2025, filed 2026-02-11 | …share amounts) Revenues Subscription solutions | 2,752 | 2,350 | 1,837 Merchant solutions | 8,804 | 6,530 | 5,223 11,556 | 8,880 | 7,060 | html | |
| 2023 | GMV (USD million) | 235,910 USD million | Shopify Inc., Form 10-K for the fiscal year ended December 31, 2025, filed 2026-02-11 | …2025 | 2024 | 2023 (in US $ millions) Monthly Recurring Revenue | 205 | 178 | 144 Gross Merchandise Volume | 378,441 | 292,275 | 235,910 | html | |
| 2023 | MRR at December 31 (USD million) | 144 USD million | Shopify Inc., Form 10-K for the fiscal year ended December 31, 2025, filed 2026-02-11 | …2025 | 2024 | 2023 (in US $ millions) Monthly Recurring Revenue | 205 | 178 | 144 Gross Merchandise Volume | 378,441 | 292,275 | 235,910 | html | |
| 2023 | MRR at December 31 (USD million) | 149 USD million | Shopify Inc., management's discussion and analysis for FY2023 (Exhibit to Form 40-F), filed 2024-02-13 | …2022 (in millions, except percentages) Monthly Recurring Revenue | $ | 149 | $ | 110 Gross Merchandise Volume | $ | 235,910 | $ | 197,167 | html | |
| 2023 | GMV (USD million) | 235,910 USD million | Shopify Inc., Q4 and full-year 2023 results press release (Form 6-K, Exhibit 99.1), filed 2024-02-13 | Gross Merchandise Volume increased 20% to $235.9 billion, an increase of $38.7 billion over the prior yearFormula: round(235910 / 1,000, 1) = 235.9 USD billion (the release states GMV in billions to one decimal; the exact figure is in the KPI table above) | html | |
| 2023 | MRR at December 31 (USD million) | 149 USD million | Shopify Inc., Q4 and full-year 2023 results press release (Form 6-K, Exhibit 99.1), filed 2024-02-13 | Monthly Recurring Revenue 3 ("MRR") as of December 31, 2023 increased 35% to $149 million compared to the prior year, | html | |
| 2023 | GPV (USD million) | 137,000 USD million | Shopify Inc., Form 10-K for the fiscal year ended December 31, 2024, filed 2025-02-11 | …2023, the Shopify Payments penetration rate was 58.1%, resulting in GMV of $137.0 billion that was facilitated using Shopify Payments. | html | |
| 2023 | Shopify Payments penetration (% of GMV) | 58.1 % of GMV | Shopify Inc., Form 10-K for the fiscal year ended December 31, 2024, filed 2025-02-11 | …December 31, 2023, the Shopify Payments penetration rate was 58.1%, resulting in GMV of $137.0 billion that was facilitated using… | html | |
| 2023 | GPV (USD million) | 137,000 USD million | Shopify Inc., management's discussion and analysis for FY2023 (Exhibit to Form 40-F), filed 2024-02-13 | …2023, the Shopify Payments penetration rate was 58.1%, resulting in GMV of $137.0 billion that was facilitated using Shopify Payments. | html | |
| 2023 | Shopify Payments penetration (% of GMV) | 58.1 % of GMV | Shopify Inc., management's discussion and analysis for FY2023 (Exhibit to Form 40-F), filed 2024-02-13 | …December 31, 2023, the Shopify Payments penetration rate was 58.1%, resulting in GMV of $137.0 billion that was facilitated using… | html | |
| 2024 | Total revenue (USD million) | 8,880 USD million | SEC EDGAR XBRL companyfacts API, Shopify Inc. (CIK 0001594805) | Revenues = 8880000000 USD; 2024-01-01 to 2024-12-31; SEC companyfacts API, 10-K filed 2026-02-11Formula: 8,880,000,000 USD / 1,000,000 = 8880 USD million | xbrl-api | |
| 2024 | Total revenue (USD million) | 8,880 USD million | Shopify Inc., Form 10-K for the fiscal year ended December 31, 2025, filed 2026-02-11 | …share amounts) Revenues Subscription solutions | 2,752 | 2,350 | 1,837 Merchant solutions | 8,804 | 6,530 | 5,223 11,556 | 8,880 | 7,060 | html | |
| 2024 | Subscription Solutions revenue (USD million) | 2,350 USD million | Shopify Inc., XBRL instance document shop-20251231_htm.xml of Form 10-K, filed 2026-02-11 | Revenues = 2350000000 USD; 2024-01-01 to 2024-12-31; SubscriptionAndCirculationMember; XBRL, 10-K filed 2026-02-11 | xbrl-api | |
| 2024 | Subscription Solutions revenue (USD million) | 2,350 USD million | Shopify Inc., Form 10-K for the fiscal year ended December 31, 2025, filed 2026-02-11 | …and per share amounts) Revenues Subscription solutions | 2,752 | 2,350 | 1,837 Merchant solutions | 8,804 | 6,530 | 5,223 11,556 | 8,880… | html | |
| 2024 | Merchant Solutions revenue (USD million) | 6,530 USD million | Shopify Inc., XBRL instance document shop-20251231_htm.xml of Form 10-K, filed 2026-02-11 | Revenues = 6530000000 USD; 2024-01-01 to 2024-12-31; ServiceMember; XBRL, 10-K filed 2026-02-11Formula: 6,530,000,000 USD / 1,000,000 = 6530 USD million | xbrl-api | |
| 2024 | Merchant Solutions revenue (USD million) | 6,530 USD million | Shopify Inc., Form 10-K for the fiscal year ended December 31, 2025, filed 2026-02-11 | …share amounts) Revenues Subscription solutions | 2,752 | 2,350 | 1,837 Merchant solutions | 8,804 | 6,530 | 5,223 11,556 | 8,880 | 7,060 | html | |
| 2024 | GMV (USD million) | 292,275 USD million | Shopify Inc., Form 10-K for the fiscal year ended December 31, 2025, filed 2026-02-11 | …2025 | 2024 | 2023 (in US $ millions) Monthly Recurring Revenue | 205 | 178 | 144 Gross Merchandise Volume | 378,441 | 292,275 | 235,910 | html | |
| 2024 | MRR at December 31 (USD million) | 178 USD million | Shopify Inc., Form 10-K for the fiscal year ended December 31, 2025, filed 2026-02-11 | …2025 | 2024 | 2023 (in US $ millions) Monthly Recurring Revenue | 205 | 178 | 144 Gross Merchandise Volume | 378,441 | 292,275 | 235,910 | html | |
| 2024 | GMV (USD million) | 292,275 USD million | Shopify Inc., Q4 and full-year 2024 results press release (Form 8-K, Exhibit 99.1), filed 2025-02-11 | …December 31, 2024 | 2023 | 2024 | 2023 GMV | 94,460 | 75,125 | 292,275 | 235,910 MRR | 178 | 144 | 178 | 144 Revenue | 2,812 | 2,144 |… | html | |
| 2024 | MRR at December 31 (USD million) | 178 USD million | Shopify Inc., Q4 and full-year 2024 results press release (Form 8-K, Exhibit 99.1), filed 2025-02-11 | …2024 | 2023 | 2024 | 2023 GMV | 94,460 | 75,125 | 292,275 | 235,910 MRR | 178 | 144 | 178 | 144 Revenue | 2,812 | 2,144 | 8,880 | 7,060 | html | |
| 2024 | GPV (USD million) | 181,000 USD million | Shopify Inc., Form 10-K for the fiscal year ended December 31, 2025, filed 2026-02-11 | …compares to a penetration rate of 61.9%, resulting in GMV of $181.0 billion that was facilitated using Shopify Payments in the same… | html | |
| 2024 | Shopify Payments penetration (% of GMV) | 61.9 % of GMV | Shopify Inc., Form 10-K for the fiscal year ended December 31, 2025, filed 2026-02-11 | This compares to a penetration rate of 61.9%, resulting in GMV of $181.0 billion that was facilitated using Shopify Payments in the same… | html | |
| 2024 | GPV (USD million) | 181,000 USD million | Shopify Inc., Form 10-K for the fiscal year ended December 31, 2024, filed 2025-02-11 | …2024, the Shopify Payments penetration rate was 61.9%, resulting in GMV of $181.0 billion that was facilitated using Shopify Payments. | html | |
| 2024 | Shopify Payments penetration (% of GMV) | 61.9 % of GMV | Shopify Inc., Form 10-K for the fiscal year ended December 31, 2024, filed 2025-02-11 | …December 31, 2024, the Shopify Payments penetration rate was 61.9%, resulting in GMV of $181.0 billion that was facilitated using… | html | |
| 2025 | Total revenue (USD million) | 11,556 USD million | SEC EDGAR XBRL companyfacts API, Shopify Inc. (CIK 0001594805) | Revenues = 11556000000 USD; 2025-01-01 to 2025-12-31; SEC companyfacts API, 10-K filed 2026-02-11Formula: 11,556,000,000 USD / 1,000,000 = 11556 USD million | xbrl-api | |
| 2025 | Total revenue (USD million) | 11,556 USD million | Shopify Inc., Form 10-K for the fiscal year ended December 31, 2025, filed 2026-02-11 | …share amounts) Revenues Subscription solutions | 2,752 | 2,350 | 1,837 Merchant solutions | 8,804 | 6,530 | 5,223 11,556 | 8,880 | 7,060 | html | |
| 2025 | Subscription Solutions revenue (USD million) | 2,752 USD million | Shopify Inc., XBRL instance document shop-20251231_htm.xml of Form 10-K, filed 2026-02-11 | Revenues = 2752000000 USD; 2025-01-01 to 2025-12-31; SubscriptionAndCirculationMember; XBRL, 10-K filed 2026-02-11 | xbrl-api | |
| 2025 | Subscription Solutions revenue (USD million) | 2,752 USD million | Shopify Inc., Form 10-K for the fiscal year ended December 31, 2025, filed 2026-02-11 | …share and per share amounts) Revenues Subscription solutions | 2,752 | 2,350 | 1,837 Merchant solutions | 8,804 | 6,530 | 5,223 11,556… | html | |
| 2025 | Merchant Solutions revenue (USD million) | 8,804 USD million | Shopify Inc., XBRL instance document shop-20251231_htm.xml of Form 10-K, filed 2026-02-11 | Revenues = 8804000000 USD; 2025-01-01 to 2025-12-31; ServiceMember; XBRL, 10-K filed 2026-02-11Formula: 8,804,000,000 USD / 1,000,000 = 8804 USD million | xbrl-api | |
| 2025 | Merchant Solutions revenue (USD million) | 8,804 USD million | Shopify Inc., Form 10-K for the fiscal year ended December 31, 2025, filed 2026-02-11 | …share amounts) Revenues Subscription solutions | 2,752 | 2,350 | 1,837 Merchant solutions | 8,804 | 6,530 | 5,223 11,556 | 8,880 | 7,060 | html | |
| 2025 | GMV (USD million) | 378,441 USD million | Shopify Inc., Form 10-K for the fiscal year ended December 31, 2025, filed 2026-02-11 | …2025 | 2024 | 2023 (in US $ millions) Monthly Recurring Revenue | 205 | 178 | 144 Gross Merchandise Volume | 378,441 | 292,275 | 235,910 | html | |
| 2025 | MRR at December 31 (USD million) | 205 USD million | Shopify Inc., Form 10-K for the fiscal year ended December 31, 2025, filed 2026-02-11 | …2025 | 2024 | 2023 (in US $ millions) Monthly Recurring Revenue | 205 | 178 | 144 Gross Merchandise Volume | 378,441 | 292,275 | 235,910 | html | |
| 2025 | GMV (USD million) | 378,441 USD million | Shopify Inc., Q4 and full-year 2025 results press release (Form 8-K, Exhibit 99.1), filed 2026-02-11 | …December 31, 2025 | 2024 | 2025 | 2024 GMV | 123,841 | 94,460 | 378,441 | 292,275 MRR | 205 | 178 | 205 | 178 Revenue | 3,672 | 2,812 |… | html | |
| 2025 | MRR at December 31 (USD million) | 205 USD million | Shopify Inc., Q4 and full-year 2025 results press release (Form 8-K, Exhibit 99.1), filed 2026-02-11 | …2025 | 2024 | 2025 | 2024 GMV | 123,841 | 94,460 | 378,441 | 292,275 MRR | 205 | 178 | 205 | 178 Revenue | 3,672 | 2,812 | 11,556 | 8,880 | html | |
| 2025 | GPV (USD million) | 248,100 USD million | Shopify Inc., Form 10-K for the fiscal year ended December 31, 2025, filed 2026-02-11 | …2025, the Shopify Payments penetration rate was 65.6%, resulting in GMV of $248.1 billion that was facilitated using Shopify Payments. | html | |
| 2025 | Shopify Payments penetration (% of GMV) | 65.6 % of GMV | Shopify Inc., Form 10-K for the fiscal year ended December 31, 2025, filed 2026-02-11 | …December 31, 2025, the Shopify Payments penetration rate was 65.6%, resulting in GMV of $248.1 billion that was facilitated using… | html | |
| 2018 | GMV (USD million) | 41,103.238 USD million | Shopify Inc., Q4 and full-year 2018 results press release (Form 6-K, Exhibit 99.1), filed 2019-02-12 | Gross Merchandise Volume, or GMV, represents the total dollar value of orders processed on the Shopify platform in the period, net of… | html | |
| 2019 | GMV (USD million) | 61,138.457 USD million | Shopify Inc., Q4 and full-year 2019 results press release (Form 6-K, Exhibit 99.1), filed 2020-02-12 | Gross Merchandise Volume, or GMV, represents the total dollar value of orders processed on the Shopify platform and on certain apps and… | html | |
| 2023 | MRR at December 31 (USD million) | 144 USD million | Shopify Inc., management's discussion and analysis for the quarter ended March 31, 2024 (Form 6-K, Exhibit 99.2), filed 2024-05-08 | …2023, June 30, 2023, September 30, 2023 and December 31, 2023 were $114 million, $135 million, $137 million, $144 million, respectively. | html | |
| 2022 | MRR at December 31 (USD million) | 109 USD million | Shopify Inc., management's discussion and analysis for FY2023 (Exhibit to Form 40-F), filed 2024-02-13 | The paid trial incentives initially launched in the second half of 2022. | html | |
| 2025 | MRR at December 31 (USD million) | 205 USD million | Shopify Inc., Q2 2025 results press release (Form 8-K, Exhibit 99.1), filed 2025-08-06 | Monthly Recurring Revenue, or MRR, is the aggregate value of all subscription plans, excluding variable platform fees, in effect on the… | html | |
| 2024 | MRR at December 31 (USD million) | 178 USD million | Shopify Inc., Q1 2025 results press release (Form 8-K, Exhibit 99.1), filed 2025-05-08 | Monthly Recurring Revenue, or MRR, is calculated by multiplying the number of merchants by the average monthly subscription plan fee in… | html | |
| 2023 | Merchant Solutions revenue (USD million) | 5,223 USD million | Shopify Inc., management's discussion and analysis for FY2023 (Exhibit to Form 40-F), filed 2024-02-13 | On June 6, 2023, the majority of our logistics businesses were sold to Flexport | html | |
| 2023 | Merchant Solutions revenue (USD million) | 5,223 USD million | Shopify Inc., Form 10-K for the fiscal year ended December 31, 2024, filed 2025-02-11 | Prior to the sales of these businesses, Shopify Fulfillment Network and Deliverr fulfillment services generated revenue from their… | html | |
| 2023 | Total revenue (USD million) | 7,060 USD million | Shopify Inc., Q4 and full-year 2023 results press release (Form 6-K, Exhibit 99.1), filed 2024-02-13 | In Q4 we delivered year-over-year revenue growth of 24%, which represents 30% growth when adjusting for the sale of our logistics businesses | html | |
| 2023 | Total revenue (USD million) | 7,060 USD million | Shopify Inc., Q3 2023 results press release (Form 6-K, Exhibit 99.1), filed 2023-11-02 | Total revenue increased 25% to $1.7 billion compared to the prior year, which translates into year-over-year growth of 30%, after… | html | |
| 2023 | GPV (USD million) | 137,040 USD million | Shopify Inc., Q4 and full-year 2023 results press release (Form 6-K, Exhibit 99.1), filed 2024-02-13 | …percentages) GMV | $ | 235,910 | $ | 197,167 | 20 | % GPV | $ | 137,040 | $ | 106,066 | 29 | % GPV as a % of GMV | 58 | % | 54 | % | 430… | html | |
| 2022 | GPV (USD million) | 106,066 USD million | Shopify Inc., Q4 and full-year 2023 results press release (Form 6-K, Exhibit 99.1), filed 2024-02-13 | …GMV | $ | 235,910 | $ | 197,167 | 20 | % GPV | $ | 137,040 | $ | 106,066 | 29 | % GPV as a % of GMV | 58 | % | 54 | % | 430 bps | html | |
| 2015 | Revenue as a share of GMV (%) | 2.66 % | Computed by Deploi | Revenue 205.233 USD million; GMV 7706.661 USD millionFormula: 205.233 / 7706.661 x 100 = 2.66 (rounded half up to two decimals) | computed | |
| 2016 | GMV growth on prior year (%) | 99.49 % | Computed by Deploi | GMV 15374.166 USD million in 2016; 7706.661 USD million in 2015Formula: (15374.166 / 7706.661 minus 1) x 100 = 99.49 (rounded half up to two decimals) | computed | |
| 2016 | Revenue growth on prior year (%) | 89.7 % | Computed by Deploi | Revenue 389.33 USD million in 2016; 205.233 USD million in 2015Formula: (389.33 / 205.233 minus 1) x 100 = 89.7 (rounded half up to two decimals) | computed | |
| 2016 | Revenue as a share of GMV (%) | 2.53 % | Computed by Deploi | Revenue 389.33 USD million; GMV 15374.166 USD millionFormula: 389.33 / 15374.166 x 100 = 2.53 (rounded half up to two decimals) | computed | |
| 2017 | GMV growth on prior year (%) | 71.2 % | Computed by Deploi | GMV 26320.15 USD million in 2017; 15374.166 USD million in 2016Formula: (26320.15 / 15374.166 minus 1) x 100 = 71.2 (rounded half up to two decimals) | computed | |
| 2017 | Revenue growth on prior year (%) | 72.94 % | Computed by Deploi | Revenue 673.304 USD million in 2017; 389.33 USD million in 2016Formula: (673.304 / 389.33 minus 1) x 100 = 72.94 (rounded half up to two decimals) | computed | |
| 2017 | Revenue as a share of GMV (%) | 2.56 % | Computed by Deploi | Revenue 673.304 USD million; GMV 26320.15 USD millionFormula: 673.304 / 26320.15 x 100 = 2.56 (rounded half up to two decimals) | computed | |
| 2018 | GMV growth on prior year (%) | 56.17 % | Computed by Deploi | GMV 41103.238 USD million in 2018; 26320.15 USD million in 2017Formula: (41103.238 / 26320.15 minus 1) x 100 = 56.17 (rounded half up to two decimals) | computed | |
| 2018 | Revenue growth on prior year (%) | 59.4 % | Computed by Deploi | Revenue 1073.229 USD million in 2018; 673.304 USD million in 2017Formula: (1073.229 / 673.304 minus 1) x 100 = 59.4 (rounded half up to two decimals) | computed | |
| 2018 | Revenue as a share of GMV (%) | 2.61 % | Computed by Deploi | Revenue 1073.229 USD million; GMV 41103.238 USD millionFormula: 1073.229 / 41103.238 x 100 = 2.61 (rounded half up to two decimals) | computed | |
| 2019 | GMV growth on prior year (%) | 48.74 % | Computed by Deploi | GMV 61138.457 USD million in 2019; 41103.238 USD million in 2018Formula: (61138.457 / 41103.238 minus 1) x 100 = 48.74 (rounded half up to two decimals) | computed | |
| 2019 | Revenue growth on prior year (%) | 47.05 % | Computed by Deploi | Revenue 1578.173 USD million in 2019; 1073.229 USD million in 2018Formula: (1578.173 / 1073.229 minus 1) x 100 = 47.05 (rounded half up to two decimals) | computed | |
| 2019 | Revenue as a share of GMV (%) | 2.58 % | Computed by Deploi | Revenue 1578.173 USD million; GMV 61138.457 USD millionFormula: 1578.173 / 61138.457 x 100 = 2.58 (rounded half up to two decimals) | computed | |
| 2020 | GMV growth on prior year (%) | 95.58 % | Computed by Deploi | GMV 119577.147 USD million in 2020; 61138.457 USD million in 2019Formula: (119577.147 / 61138.457 minus 1) x 100 = 95.58 (rounded half up to two decimals) | computed | |
| 2020 | Revenue growth on prior year (%) | 85.63 % | Computed by Deploi | Revenue 2929.491 USD million in 2020; 1578.173 USD million in 2019Formula: (2929.491 / 1578.173 minus 1) x 100 = 85.63 (rounded half up to two decimals) | computed | |
| 2020 | Revenue as a share of GMV (%) | 2.45 % | Computed by Deploi | Revenue 2929.491 USD million; GMV 119577.147 USD millionFormula: 2929.491 / 119577.147 x 100 = 2.45 (rounded half up to two decimals) | computed | |
| 2021 | GMV growth on prior year (%) | 46.65 % | Computed by Deploi | GMV 175361.814 USD million in 2021; 119577.147 USD million in 2020Formula: (175361.814 / 119577.147 minus 1) x 100 = 46.65 (rounded half up to two decimals) | computed | |
| 2021 | Revenue growth on prior year (%) | 57.43 % | Computed by Deploi | Revenue 4611.856 USD million in 2021; 2929.491 USD million in 2020Formula: (4611.856 / 2929.491 minus 1) x 100 = 57.43 (rounded half up to two decimals) | computed | |
| 2021 | Revenue as a share of GMV (%) | 2.63 % | Computed by Deploi | Revenue 4611.856 USD million; GMV 175361.814 USD millionFormula: 4611.856 / 175361.814 x 100 = 2.63 (rounded half up to two decimals) | computed | |
| 2022 | GMV growth on prior year (%) | 12.43 % | Computed by Deploi | GMV 197167 USD million in 2022; 175361.814 USD million in 2021Formula: (197167 / 175361.814 minus 1) x 100 = 12.43 (rounded half up to two decimals) | computed | |
| 2022 | Revenue growth on prior year (%) | 21.43 % | Computed by Deploi | Revenue 5600 USD million in 2022; 4611.856 USD million in 2021Formula: (5600 / 4611.856 minus 1) x 100 = 21.43 (rounded half up to two decimals) | computed | |
| 2022 | Revenue as a share of GMV (%) | 2.84 % | Computed by Deploi | Revenue 5600 USD million; GMV 197167 USD millionFormula: 5600 / 197167 x 100 = 2.84 (rounded half up to two decimals) | computed | |
| 2023 | GMV growth on prior year (%) | 19.65 % | Computed by Deploi | GMV 235910 USD million in 2023; 197167 USD million in 2022Formula: (235910 / 197167 minus 1) x 100 = 19.65 (rounded half up to two decimals) | computed | |
| 2023 | Revenue growth on prior year (%) | 26.07 % | Computed by Deploi | Revenue 7060 USD million in 2023; 5600 USD million in 2022Formula: (7060 / 5600 minus 1) x 100 = 26.07 (rounded half up to two decimals) | computed | |
| 2023 | Revenue as a share of GMV (%) | 2.99 % | Computed by Deploi | Revenue 7060 USD million; GMV 235910 USD millionFormula: 7060 / 235910 x 100 = 2.99 (rounded half up to two decimals) | computed | |
| 2024 | GMV growth on prior year (%) | 23.89 % | Computed by Deploi | GMV 292275 USD million in 2024; 235910 USD million in 2023Formula: (292275 / 235910 minus 1) x 100 = 23.89 (rounded half up to two decimals) | computed | |
| 2024 | Revenue growth on prior year (%) | 25.78 % | Computed by Deploi | Revenue 8880 USD million in 2024; 7060 USD million in 2023Formula: (8880 / 7060 minus 1) x 100 = 25.78 (rounded half up to two decimals) | computed | |
| 2024 | Revenue as a share of GMV (%) | 3.04 % | Computed by Deploi | Revenue 8880 USD million; GMV 292275 USD millionFormula: 8880 / 292275 x 100 = 3.04 (rounded half up to two decimals) | computed | |
| 2025 | GMV growth on prior year (%) | 29.48 % | Computed by Deploi | GMV 378441 USD million in 2025; 292275 USD million in 2024Formula: (378441 / 292275 minus 1) x 100 = 29.48 (rounded half up to two decimals) | computed | |
| 2025 | Revenue growth on prior year (%) | 30.14 % | Computed by Deploi | Revenue 11556 USD million in 2025; 8880 USD million in 2024Formula: (11556 / 8880 minus 1) x 100 = 30.14 (rounded half up to two decimals) | computed | |
| 2025 | Revenue as a share of GMV (%) | 3.05 % | Computed by Deploi | Revenue 11556 USD million; GMV 378441 USD millionFormula: 11556 / 378441 x 100 = 3.05 (rounded half up to two decimals) | computed |
Methodology
Caveats: Shopify annual metrics, fiscal years 2015 to 2025
- Fiscal year equals calendar year in every row. The 10-K cover reads "For the fiscal year ended December 31, 2025". The annual report form changed over the period: Form 20-F for FY2015, Form 40-F for FY2016 to FY2023 (with quarterly results on Form 6-K) and Form 10-K from FY2024.
- Each value is the figure in the most recently filed annual report that states the fiscal year, so a later restatement replaces the earlier number. Where only rounding differs, the later rounded figure is published and the finer one is in the row note (FY2022 revenue 5,599.864 against 5,600; FY2022 GMV 197,166.882 against 197,167). Annual reports through FY2022 give GMV and MRR in thousands of dollars; from the FY2023 MD&A they give whole millions.
- Revenue is read by script from SEC XBRL. Shopify's XBRL tag for total revenue changed over time, which changes no number, and Subscription Solutions plus Merchant Solutions equals total revenue in every year. Subscription Solutions includes variable platform fees. The SEC companyfacts API omits dimensional facts, so the two revenue lines from FY2017 come from each filing's XBRL instance document.
- GMV is a management metric, not revenue ("GMV does not represent revenue earned by us."), and sits outside the audited statements, as do MRR, GPV and penetration. The GMV wording widened with the Q4 2019 results to include "certain apps and channels for which a revenue-sharing arrangement is in place". The FY2019 MD&A shows the same 2018 figure as the FY2018 MD&A, so 2018 was not recast, and Shopify does not quantify the effect. Growth from 2018 to 2019 is therefore not strictly like for like.
- MRR is the monthly subscription plan fees in force on the last day of the period, excluding variable platform fees. It is not revenue. In the first quarter of 2024 Shopify revised how paid trials enter MRR, which lowered December 31, 2023 from $149 million as first published to $144 million. MRR at December 31, 2022 moved without explanation: $109.5 million in the Q4 2022 release, $110 million in the FY2023 MD&A and $109 million in the FY2024 Form 10-K, the value used here. The Q2 2025 release reworded the MRR definition and changed no value.
- Shopify sold its logistics businesses in the second quarter of 2023 ("On June 6, 2023, the majority of our logistics businesses were sold to Flexport"). Their revenue was reported in Merchant Solutions, so FY2015 to FY2022 and part of FY2023 include revenue that FY2024 and FY2025 do not. Shopify quantifies the effect by quarter only, and this dataset does not adjust revenue. Read growth across 2023 and 2024 with that in mind.
- GPV (gross payments volume) is the part of GMV processed through Shopify Payments. Penetration is GPV divided by GMV: a whole percent for FY2015 to FY2017 (results releases) and one decimal from FY2018 (MD&A and Form 10-K). Shopify states GPV in billions to one decimal, so each GPV value carries a rounding band of plus or minus 50 USD million, and the recomputed ratio agrees with the stated penetration in every row within that band. The Q4 2024 and Q4 2025 releases give no dollar GPV, so FY2024 and FY2025 rest on the Form 10-K.
- Three columns are Deploi's arithmetic and not Shopify statements: gmvGrowthPct and revenueGrowthPct (each year against the year before) and revenueShareOfGmvPct (revenue divided by GMV). Each is rounded to two decimals, and the formula for every value is in the provenance table. All amounts are US dollars ("Shopify reports in U.S. dollars and in accordance with U.S. GAAP").
- The series starts at FY2015 because GPV and penetration were first published, as 2015 comparatives, in the Q4 2016 results release.
Deploi's charts and compilation are licensed CC BY 4.0. The underlying facts belong to their sources, which are named on every page. How Deploi Shopify Data works.
Sources
Tier A sources are primary documents: filings, official releases and official price pages. How sources are ranked.
Show all 34 sources
- Tier ASEC EDGAR XBRL companyfacts API, Shopify Inc. (CIK 0001594805)
U.S. Securities and Exchange Commission (EDGAR) · TEXT · Read on
- Tier AShopify Inc., management's discussion and analysis for FY2016 (Exhibit to Form 40-F), filed 2017-02-15
Shopify Inc. · HTML · Read on
- Tier AShopify Inc., Q4 and full-year 2015 results press release (Form 6-K, main document), filed 2016-02-17
Shopify Inc. · HTML · Read on
- Tier AShopify Inc., Q4 and full-year 2016 results press release (Form 6-K, Exhibit 99.1), filed 2017-02-15
Shopify Inc. · HTML · Read on
- Tier AShopify Inc., management's discussion and analysis for FY2017 (Exhibit to Form 40-F), filed 2018-02-15
Shopify Inc. · HTML · Read on
- Tier AShopify Inc., Q4 and full-year 2017 results press release (Form 6-K, Exhibit 99.1), filed 2018-02-15
Shopify Inc. · HTML · Read on
- Tier AShopify Inc., management's discussion and analysis for FY2018 (Exhibit to Form 40-F), filed 2019-02-12
Shopify Inc. · HTML · Read on
- Tier AShopify Inc., XBRL instance document shop-20181231.xml of Form 40-F, filed 2019-02-12
Shopify Inc. · XBRL · Read on
- Tier AShopify Inc., Q4 and full-year 2018 results press release (Form 6-K, Exhibit 99.1), filed 2019-02-12
Shopify Inc. · HTML · Read on
- Tier AShopify Inc., management's discussion and analysis for FY2019 (Exhibit to Form 40-F), filed 2020-02-12
Shopify Inc. · HTML · Read on
- Tier AShopify Inc., XBRL instance document form40-f2019_htm.xml of Form 40-F, filed 2020-02-12
Shopify Inc. · XBRL · Read on
- Tier AShopify Inc., management's discussion and analysis for FY2020 (Exhibit to Form 40-F), filed 2021-02-17
Shopify Inc. · HTML · Read on
- Tier AShopify Inc., XBRL instance document shop-20201231_htm.xml of Form 40-F, filed 2021-02-17
Shopify Inc. · XBRL · Read on
- Tier AShopify Inc., Q4 and full-year 2019 results press release (Form 6-K, Exhibit 99.1), filed 2020-02-12
Shopify Inc. · HTML · Read on
- Tier AShopify Inc., management's discussion and analysis for FY2021 (Exhibit to Form 40-F), filed 2022-02-16
Shopify Inc. · HTML · Read on
- Tier AShopify Inc., XBRL instance document shop-20211231_htm.xml of Form 40-F, filed 2022-02-16
Shopify Inc. · XBRL · Read on
- Tier AShopify Inc., Q4 and full-year 2020 results press release (Form 6-K, Exhibit 99.1), filed 2021-02-17
Shopify Inc. · HTML · Read on
- Tier AShopify Inc., management's discussion and analysis for FY2022 (Exhibit to Form 40-F), filed 2023-02-16
Shopify Inc. · HTML · Read on
- Tier AShopify Inc., XBRL instance document shop-20221231_htm.xml of Form 40-F, filed 2023-02-16
Shopify Inc. · XBRL · Read on
- Tier AShopify Inc., Q4 and full-year 2021 results press release (Form 6-K, Exhibit 99.1), filed 2022-02-16
Shopify Inc. · HTML · Read on
- Tier AShopify Inc., Form 10-K for the fiscal year ended December 31, 2024, filed 2025-02-11
Shopify Inc. · HTML · Read on
- Tier AShopify Inc., XBRL instance document shop-20241231_htm.xml of Form 10-K, filed 2025-02-11
Shopify Inc. · XBRL · Read on
- Tier AShopify Inc., management's discussion and analysis for FY2023 (Exhibit to Form 40-F), filed 2024-02-13
Shopify Inc. · HTML · Read on
- Tier AShopify Inc., Q4 and full-year 2022 results press release (Form 6-K, Exhibit 99.1), filed 2023-02-15
Shopify Inc. · HTML · Read on
- Tier AShopify Inc., Form 10-K for the fiscal year ended December 31, 2025, filed 2026-02-11
Shopify Inc. · HTML · Read on
- Tier AShopify Inc., XBRL instance document shop-20251231_htm.xml of Form 10-K, filed 2026-02-11
Shopify Inc. · XBRL · Read on
- Tier AShopify Inc., Q4 and full-year 2023 results press release (Form 6-K, Exhibit 99.1), filed 2024-02-13
Shopify Inc. · HTML · Read on
- Tier AShopify Inc., Q4 and full-year 2024 results press release (Form 8-K, Exhibit 99.1), filed 2025-02-11
Shopify Inc. · HTML · Read on
- Tier AShopify Inc., Q4 and full-year 2025 results press release (Form 8-K, Exhibit 99.1), filed 2026-02-11
Shopify Inc. · HTML · Read on
- Tier ASEC EDGAR submissions index for Shopify Inc. (CIK 0001594805)
U.S. Securities and Exchange Commission (EDGAR) · API · Read on
- Tier A
- Tier AShopify Inc., Q2 2025 results press release (Form 8-K, Exhibit 99.1), filed 2025-08-06
Shopify Inc. · HTML · Read on
- Tier AShopify Inc., Q1 2025 results press release (Form 8-K, Exhibit 99.1), filed 2025-05-08
Shopify Inc. · HTML · Read on
- Tier AShopify Inc., Q3 2023 results press release (Form 6-K, Exhibit 99.1), filed 2023-11-02
Shopify Inc. · HTML · Read on
Cite and reuse
Deploi's charts and compilation are licensed CC BY 4.0. The underlying facts belong to their sources, which are named on every page.
APA
Deploi. (2026). Shopify annual metrics, fiscal years 2015 to 2025 (Version 1) [Data set]. https://deploi.ca/shopify/data/datasets/shopify-annual-metrics Retrieved October 13, 2026.
BibTeX
@misc{deploi_shopify_annual_metrics_2026,
  author = {{Deploi}},
  title = {Shopify annual metrics, fiscal years 2015 to 2025},
  year = {2026},
  version = {1},
  url = {https://deploi.ca/shopify/data/datasets/shopify-annual-metrics},
  note = {Accessed 2026-10-13}
}
Downloads
- Data: Shopify annual metrics, fiscal years 2015 to 2025 CSV
Changes
- · Shopify annual metrics, fiscal years 2015 to 2025
First release. Eleven fiscal years (2015 to 2025). Revenue and its two lines are read by script from the SEC's structured filing data. GMV, recurring revenue and payments figures are read from annual reports and results releases. Restated, revised and rounded figures are recorded in row notes and caveats. Deploi added three computed columns.