
E-commerce share of US manufacturing shipments and merchant wholesale sales, 2015 to 2024
Version 1. 20 rows, 9 columns.
By Martin DejnickiUpdated Data through 2024
Short answer
E-commerce shipments or sales as a percentage of the total for US manufacturing and for merchant wholesalers except manufacturers' sales branches and offices, for 2015 to 2024, with values in USD millions. Sources are Census Bureau E-Stats tables, the Annual Survey of Manufactures, the Annual Wholesale Trade Survey and Annual Integrated Economic Survey tables, retrieved November 19, 2026.
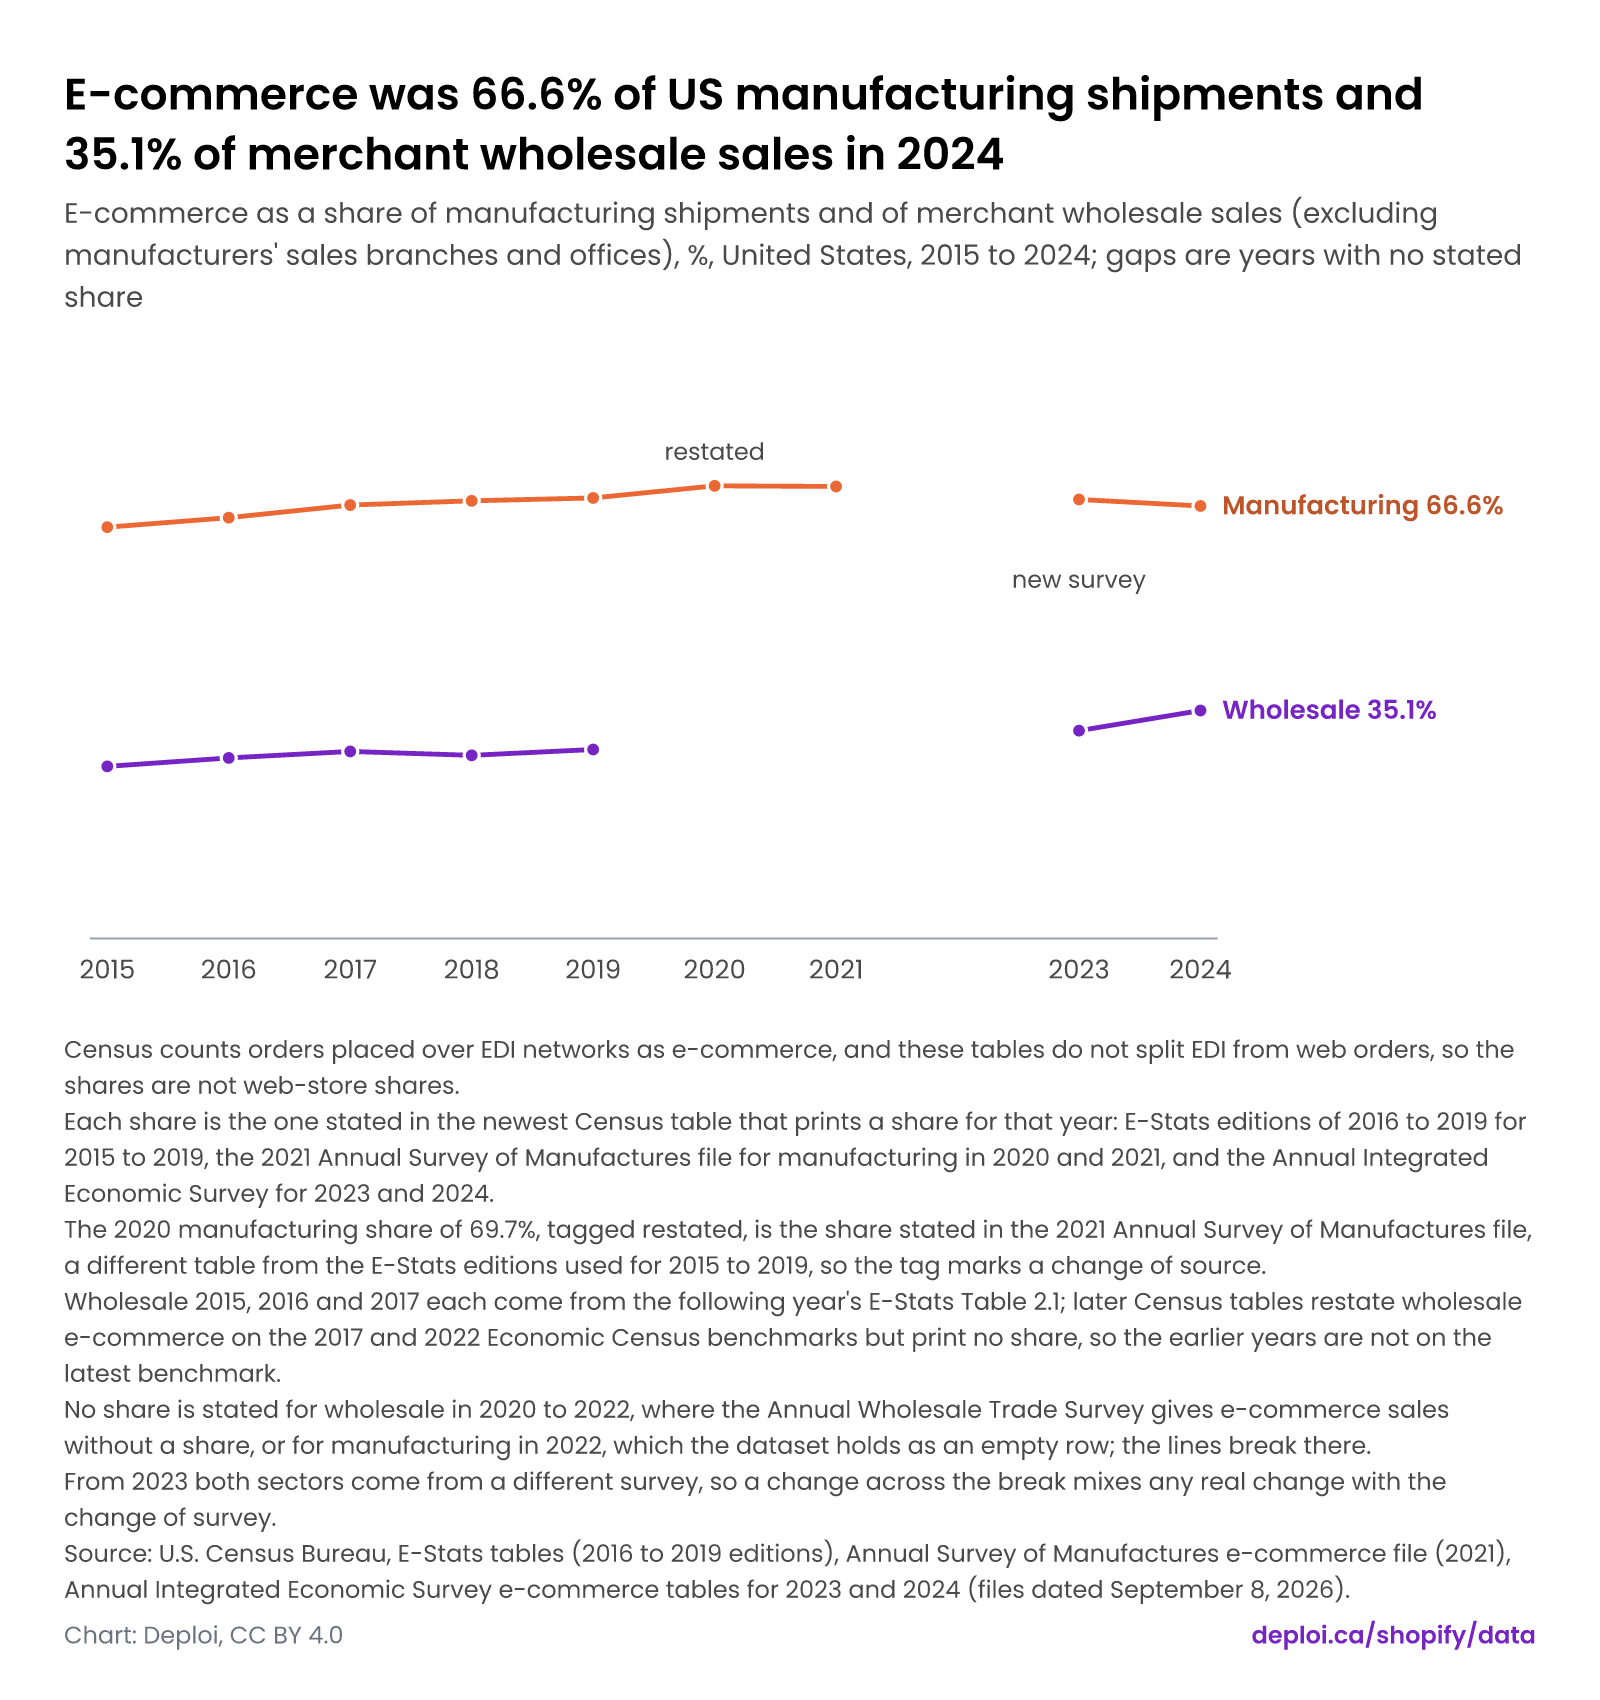
E-commerce was 66.6% of US manufacturing shipments and 35.1% of merchant wholesale sales in 2024
E-commerce as a share of manufacturing shipments and of merchant wholesale sales (excluding manufacturers' sales branches and offices), %, United States, 2015 to 2024; gaps are years with no stated share
- Census counts orders placed over EDI networks as e-commerce, and these tables do not split EDI from web orders, so the shares are not web-store shares.
- Each share is the one stated in the newest Census table that prints a share for that year: E-Stats editions of 2016 to 2019 for 2015 to 2019, the 2021 Annual Survey of Manufactures file for manufacturing in 2020 and 2021, and the Annual Integrated Economic Survey for 2023 and 2024.
- The 2020 manufacturing share of 69.7%, tagged restated, is the share stated in the 2021 Annual Survey of Manufactures file, a different table from the E-Stats editions used for 2015 to 2019, so the tag marks a change of source.
- Wholesale 2015, 2016 and 2017 each come from the following year's E-Stats Table 2.1; later Census tables restate wholesale e-commerce on the 2017 and 2022 Economic Census benchmarks but print no share, so the earlier years are not on the latest benchmark.
- No share is stated for wholesale in 2020 to 2022, where the Annual Wholesale Trade Survey gives e-commerce sales without a share, or for manufacturing in 2022, which the dataset holds as an empty row; the lines break there.
- From 2023 both sectors come from a different survey, so a change across the break mixes any real change with the change of survey.
Source: U.S. Census Bureau, E-Stats tables (2016 to 2019 editions), Annual Survey of Manufactures e-commerce file (2021), Annual Integrated Economic Survey e-commerce tables for 2023 and 2024 (files dated September 8, 2026). Read on .
About this dataset
E-commerce shipments or sales as a percentage of the total for US manufacturing and for merchant wholesalers except manufacturers' sales branches and offices, for 2015 to 2024, with values in USD millions. Sources are Census Bureau E-Stats tables, the Annual Survey of Manufactures, the Annual Wholesale Trade Survey and Annual Integrated Economic Survey tables, retrieved November 19, 2026. Census counts EDI orders as e-commerce.
- Version
- 1
- Coverage in time
- 2015 to 2024
- Coverage in space
- United States
- Last updated
- November 19, 2026
- License
- CC BY 4.0. Deploi's compilation is CC BY 4.0. The underlying figures belong to their publishers and are cited to the sources listed.
Variables
The CSV header uses the column name.
| Column name | Label | Type | Unit | Meaning |
|---|---|---|---|---|
| rowKey | Row | string | text | Stable key of the row: sector and year. |
| sector | Sector | string | text | Manufacturing, or merchant wholesalers except manufacturers' sales branches and offices. |
| year | Year | number | year | Reference year. |
| totalUsdM | Total shipments or sales | number | USD million | Value of manufacturing shipments or of merchant wholesale sales, as Census states it. |
| ecommerceUsdM | Ecommerce shipments or sales | number | USD million | Ecommerce value as Census defines it: orders placed over computer networks, including EDI. |
| ecommerceSharePct | Ecommerce share | number | % | Ecommerce as a percent of the total, as Census states it for that year. Empty where no share is stated. |
| ediSharePct | Share via EDI | string | % | Share of ecommerce through EDI. Empty: the tables read do not split EDI from other networks. |
| releaseDate | Released | date | date | Release date of the Census report the value comes from. Empty where the source does not state one. |
| sectorLabel | Sector, short name | string | text | Short sector name for chart labels, Manufacturing or Wholesale. |
The data
Where each value comes from
Every value, the document it was read from, the exact place in it and the date it was read. Computed values show their formula.
Show all 105 traced values
| Row | Field | Value | Source | Where in the source | Read on | Method |
|---|---|---|---|---|---|---|
| manufacturing|2015 | Sector | Manufacturing | E-Stats Historical Table 1: U.S. Manufacturing Shipments, Total and E-commerce Value 2019 to 1999 (converted to CSV text) | Historical Table 1. U.S. Manufacturing Shipments - Total and E-commerce Value: 2019-1999 | html | |
| manufacturing|2015 | Year | 2015 | E-Stats 2016 Table 1: U.S. Manufacturing Shipments, Total and E-commerce Value (xlsx converted to CSV text) | Table 1. U.S. Manufacturing Shipments - Total and E-commerce Value: 2016 and 2015 | text | |
| manufacturing|2015 | Total shipments or sales | 5,519,018 USD million | E-Stats Historical Table 1: U.S. Manufacturing Shipments, Total and E-commerce Value 2019 to 1999 (converted to CSV text) | ,Total Manufacturing,5731187,3887623,5890663,3969886,5587964,3729525,5354694,3469624,5519018,3495326, | text | |
| manufacturing|2015 | Ecommerce shipments or sales | 3,495,326 USD million | E-Stats Historical Table 1: U.S. Manufacturing Shipments, Total and E-commerce Value 2019 to 1999 (converted to CSV text) | Same passage as Total shipments or sales | text | |
| manufacturing|2015 | Ecommerce share | 63.33238992878810 % | E-Stats 2016 Table 1: U.S. Manufacturing Shipments, Total and E-commerce Value (xlsx converted to CSV text) | Total Manufacturing,5354694,3469624,5519018,3495326,-2.977413735559478,-0.7353248309313638,64.7959341841009,63.33238992878806,100.00011528626733, | text | |
| manufacturing|2016 | Sector | Manufacturing | E-Stats Historical Table 1: U.S. Manufacturing Shipments, Total and E-commerce Value 2019 to 1999 (converted to CSV text) | Historical Table 1. U.S. Manufacturing Shipments - Total and E-commerce Value: 2019-1999 | html | |
| manufacturing|2016 | Year | 2016 | E-Stats 2017 Table 1: U.S. Manufacturing Shipments, Total and E-commerce Value (xlsx converted to CSV text) | Table 1. U.S. Manufacturing Shipments - Total and E-commerce Value: 2017 and 2016 | text | |
| manufacturing|2016 | Total shipments or sales | 5,354,694 USD million | E-Stats Historical Table 1: U.S. Manufacturing Shipments, Total and E-commerce Value 2019 to 1999 (converted to CSV text) | ,Total Manufacturing,5731187,3887623,5890663,3969886,5587964,3729525,5354694,3469624, | text | |
| manufacturing|2016 | Ecommerce shipments or sales | 3,469,624 USD million | E-Stats Historical Table 1: U.S. Manufacturing Shipments, Total and E-commerce Value 2019 to 1999 (converted to CSV text) | Same passage as Total shipments or sales | text | |
| manufacturing|2016 | Ecommerce share | 64.7959341841009 % | E-Stats 2017 Table 1: U.S. Manufacturing Shipments, Total and E-commerce Value (xlsx converted to CSV text) | Total Manufacturing,5587964,3729525,5354694,3469624,4.3563647147717495,7.490754041360101,66.74210857478681,64.7959341841009,99.99999316266816, | text | |
| manufacturing|2016 | Released | 2018-05-24 | E-Stats data tables page (multi-sector tables 1998 to 2019, last revised 2021-10-08) | May 24, 2018 | html | |
| manufacturing|2017 | Sector | Manufacturing | E-Stats Historical Table 1: U.S. Manufacturing Shipments, Total and E-commerce Value 2019 to 1999 (converted to CSV text) | Historical Table 1. U.S. Manufacturing Shipments - Total and E-commerce Value: 2019-1999 | text | |
| manufacturing|2017 | Year | 2017 | E-Stats 2018 Table 1: U.S. Manufacturing Shipments, Total and E-commerce Value (xlsx converted to CSV text) | Table 1. U.S. Manufacturing Shipments - Total and E-commerce Value: 2018 and 2017 | text | |
| manufacturing|2017 | Total shipments or sales | 5,587,964 USD million | E-Stats Historical Table 1: U.S. Manufacturing Shipments, Total and E-commerce Value 2019 to 1999 (converted to CSV text) | ,Total Manufacturing,5731187,3887623,5890663,3969886,5587964,3729525, | text | |
| manufacturing|2017 | Ecommerce shipments or sales | 3,729,525 USD million | E-Stats Historical Table 1: U.S. Manufacturing Shipments, Total and E-commerce Value 2019 to 1999 (converted to CSV text) | Same passage as Total shipments or sales | text | |
| manufacturing|2017 | Ecommerce share | 66.74210857478680 % | E-Stats 2018 Table 1: U.S. Manufacturing Shipments, Total and E-commerce Value (xlsx converted to CSV text) | Total Manufacturing,5954927,4010570,5587964,3729525,6.567025127577772,7.535678135955651,67.34876850715382,66.74210857478681,100, | text | |
| manufacturing|2017 | Released | 2019-09-19 | E-Stats data tables page (multi-sector tables 1998 to 2019, last revised 2021-10-08) | September 19, 2019 | html | |
| manufacturing|2018 | Sector | Manufacturing | E-Stats Historical Table 1: U.S. Manufacturing Shipments, Total and E-commerce Value 2019 to 1999 (converted to CSV text) | Historical Table 1. U.S. Manufacturing Shipments - Total and E-commerce Value: 2019-1999 | text | |
| manufacturing|2018 | Year | 2018 | E-Stats 2019 Table 1: U.S. Manufacturing Shipments, Total and E-commerce Value (xlsx converted to CSV text) | Table 1. U.S. Manufacturing Shipments - Total and E-commerce Value: 2019 and 2018 | text | |
| manufacturing|2018 | Total shipments or sales | 5,890,663 USD million | E-Stats 2019 Table 1: U.S. Manufacturing Shipments, Total and E-commerce Value (xlsx converted to CSV text) | ,Total Manufacturing,5731187,3887623,5890663,3969886, | text | |
| manufacturing|2018 | Ecommerce shipments or sales | 3,969,886 USD million | E-Stats 2019 Table 1: U.S. Manufacturing Shipments, Total and E-commerce Value (xlsx converted to CSV text) | Same passage as Total shipments or sales | text | |
| manufacturing|2018 | Ecommerce share | 67.3928554391925 % | E-Stats 2019 Table 1: U.S. Manufacturing Shipments, Total and E-commerce Value (xlsx converted to CSV text) | Total Manufacturing,5731187,3887623,5890663,3969886,-2.7072674162483916,-2.0721753722902876,67.83277181498353,67.3928554391925,100, | text | |
| manufacturing|2019 | Sector | Manufacturing | E-Stats Historical Table 1: U.S. Manufacturing Shipments, Total and E-commerce Value 2019 to 1999 (converted to CSV text) | Historical Table 1. U.S. Manufacturing Shipments - Total and E-commerce Value: 2019-1999 | html | |
| manufacturing|2019 | Year | 2019 | E-Stats 2019 Table 1: U.S. Manufacturing Shipments, Total and E-commerce Value (xlsx converted to CSV text) | Table 1. U.S. Manufacturing Shipments - Total and E-commerce Value: 2019 and 2018 | text | |
| manufacturing|2019 | Total shipments or sales | 5,731,187 USD million | E-Stats 2019 Table 1: U.S. Manufacturing Shipments, Total and E-commerce Value (xlsx converted to CSV text) | ,Total Manufacturing,5731187,3887623, | text | |
| manufacturing|2019 | Ecommerce shipments or sales | 3,887,623 USD million | E-Stats 2019 Table 1: U.S. Manufacturing Shipments, Total and E-commerce Value (xlsx converted to CSV text) | Same passage as Total shipments or sales | text | |
| manufacturing|2019 | Ecommerce share | 67.83277181498350 % | E-Stats 2019 Table 1: U.S. Manufacturing Shipments, Total and E-commerce Value (xlsx converted to CSV text) | Total Manufacturing,5731187,3887623,5890663,3969886,-2.7072674162483916,-2.0721753722902876,67.83277181498353,67.3928554391925,100, | text | |
| manufacturing|2019 | Released | 2021-07-27 | E-Stats data tables page (multi-sector tables 1998 to 2019, last revised 2021-10-08) | July 27, 2021 | html | |
| manufacturing|2020 | Sector | Manufacturing | Annual Survey of Manufactures e-commerce file AM1831ECOMM (the .dat file inside the zip), vintage 2021 (value of shipments and e-commerce shipments, NAICS 2017, years 2018 to 2021) | 0100000US|United States||01|00|31|2|31-33|Manufacturing||2020|5203861496||.1||3626639623||.1||69.7||.1| | text | |
| manufacturing|2020 | Year | 2020 | Annual Survey of Manufactures e-commerce file AM1831ECOMM (the .dat file inside the zip), vintage 2021 (value of shipments and e-commerce shipments, NAICS 2017, years 2018 to 2021) | Same passage as Sector | text | |
| manufacturing|2020 | Total shipments or sales | 5,203,861.496 USD million | Annual Survey of Manufactures e-commerce file AM1831ECOMM (the .dat file inside the zip), vintage 2021 (value of shipments and e-commerce shipments, NAICS 2017, years 2018 to 2021) | Same passage as Sector | text | |
| manufacturing|2020 | Ecommerce shipments or sales | 3,626,639.623 USD million | Annual Survey of Manufactures e-commerce file AM1831ECOMM (the .dat file inside the zip), vintage 2021 (value of shipments and e-commerce shipments, NAICS 2017, years 2018 to 2021) | Same passage as Sector | text | |
| manufacturing|2020 | Ecommerce share | 69.7 % | Annual Survey of Manufactures e-commerce file AM1831ECOMM (the .dat file inside the zip), vintage 2021 (value of shipments and e-commerce shipments, NAICS 2017, years 2018 to 2021) | Same passage as Sector | text | |
| manufacturing|2021 | Sector | Manufacturing | Annual Survey of Manufactures e-commerce file AM1831ECOMM (the .dat file inside the zip), vintage 2021 (value of shipments and e-commerce shipments, NAICS 2017, years 2018 to 2021) | 0100000US|United States||01|00|31|2|31-33|Manufacturing||2021|6079602177||.1||4230833859||.1||69.6||.1| | text | |
| manufacturing|2021 | Year | 2021 | Annual Survey of Manufactures e-commerce file AM1831ECOMM (the .dat file inside the zip), vintage 2021 (value of shipments and e-commerce shipments, NAICS 2017, years 2018 to 2021) | Same passage as Sector | text | |
| manufacturing|2021 | Total shipments or sales | 6,079,602.177 USD million | Annual Survey of Manufactures e-commerce file AM1831ECOMM (the .dat file inside the zip), vintage 2021 (value of shipments and e-commerce shipments, NAICS 2017, years 2018 to 2021) | Same passage as Sector | text | |
| manufacturing|2021 | Ecommerce shipments or sales | 4,230,833.859 USD million | Annual Survey of Manufactures e-commerce file AM1831ECOMM (the .dat file inside the zip), vintage 2021 (value of shipments and e-commerce shipments, NAICS 2017, years 2018 to 2021) | Same passage as Sector | text | |
| manufacturing|2021 | Ecommerce share | 69.6 % | Annual Survey of Manufactures e-commerce file AM1831ECOMM (the .dat file inside the zip), vintage 2021 (value of shipments and e-commerce shipments, NAICS 2017, years 2018 to 2021) | Same passage as Sector | text | |
| manufacturing|2021 | Released | 2023-05-25 | E-Stats 2021: Measuring the Electronic Economy (publication page, report E21-ESTATS) | May 25, 2023 | html | |
| manufacturing|2022 | Released | 2025-03-26 | E-Stats 2022: Measuring the Electronic Economy (publication page, report E22-ESTATS) | March 26, 2025 | html | |
| manufacturing|2023 | Sector | Manufacturing | AIES 2023 Selected Sectors: E-commerce for Employer Firms in the U.S. (AIES00ECOM, pipe-delimited data plus field list, files dated 2026-09-08) | 01|00|0100000US|United States||31|31-33|Manufacturing||00|All establishments|00|All establishments|2023|7038342284||4757247276||67.6||.1||.1||.1||2|| | text | |
| manufacturing|2023 | Year | 2023 | AIES 2023 Selected Sectors: E-commerce for Employer Firms in the U.S. (AIES00ECOM, pipe-delimited data plus field list, files dated 2026-09-08) | Same passage as Sector | text | |
| manufacturing|2023 | Total shipments or sales | 7,038,342.284 USD million | AIES 2023 Selected Sectors: E-commerce for Employer Firms in the U.S. (AIES00ECOM, pipe-delimited data plus field list, files dated 2026-09-08) | Same passage as Sector | text | |
| manufacturing|2023 | Ecommerce shipments or sales | 4,757,247.276 USD million | AIES 2023 Selected Sectors: E-commerce for Employer Firms in the U.S. (AIES00ECOM, pipe-delimited data plus field list, files dated 2026-09-08) | Same passage as Sector | text | |
| manufacturing|2023 | Ecommerce share | 67.6 % | AIES 2023 Selected Sectors: E-commerce for Employer Firms in the U.S. (AIES00ECOM, pipe-delimited data plus field list, files dated 2026-09-08) | Same passage as Sector | text | |
| manufacturing|2024 | Sector | Manufacturing | AIES 2024 Selected Sectors: E-commerce for Employer Firms in the U.S. (AIES00ECOM, pipe-delimited data plus field list, files dated 2026-09-08) | 01|00|0100000US|United States||31|31-33|Manufacturing||00|All establishments|00|All establishments|2024|6980505677||4649408353||66.6||.1||.1||.1||2|| | text | |
| manufacturing|2024 | Year | 2024 | AIES 2024 Selected Sectors: E-commerce for Employer Firms in the U.S. (AIES00ECOM, pipe-delimited data plus field list, files dated 2026-09-08) | Same passage as Sector | text | |
| manufacturing|2024 | Total shipments or sales | 6,980,505.677 USD million | AIES 2024 Selected Sectors: E-commerce for Employer Firms in the U.S. (AIES00ECOM, pipe-delimited data plus field list, files dated 2026-09-08) | Same passage as Sector | text | |
| manufacturing|2024 | Ecommerce shipments or sales | 4,649,408.353 USD million | AIES 2024 Selected Sectors: E-commerce for Employer Firms in the U.S. (AIES00ECOM, pipe-delimited data plus field list, files dated 2026-09-08) | Same passage as Sector | text | |
| manufacturing|2024 | Ecommerce share | 66.6 % | AIES 2024 Selected Sectors: E-commerce for Employer Firms in the U.S. (AIES00ECOM, pipe-delimited data plus field list, files dated 2026-09-08) | Same passage as Sector | text | |
| wholesale|2015 | Sector | Merchant wholesalers, except manufacturers' sales branches and offices | E-Stats 2016 Table 2.1: U.S. Merchant Wholesale Trade Sales excluding manufacturers' sales branches and offices, Total and E-commerce (xls converted to CSV text) | Table 2.1. U.S. Merchant Wholesale Trade Sales, Excluding Manufacturers' Sales Branches and Offices - Total and E-commerce: 2016 and 2015 | text | |
| wholesale|2015 | Year | 2015 | E-Stats 2016 Table 2.1: U.S. Merchant Wholesale Trade Sales excluding manufacturers' sales branches and offices, Total and E-commerce (xls converted to CSV text) | Same passage as Sector | text | |
| wholesale|2015 | Total shipments or sales | 5,292,436 USD million | E-Stats 2016 Table 2.1: U.S. Merchant Wholesale Trade Sales excluding manufacturers' sales branches and offices, Total and E-commerce (xls converted to CSV text) | 42.0,Total Merchant Wholesale Trade Excluding Manufacturers' Sales Branches and Offices,5225877.0,1420907.0,5292436.0,1400138.0,-1.3,1.5,27.2,26.5,100.0 | text | |
| wholesale|2015 | Ecommerce shipments or sales | 1,400,138 USD million | E-Stats 2016 Table 2.1: U.S. Merchant Wholesale Trade Sales excluding manufacturers' sales branches and offices, Total and E-commerce (xls converted to CSV text) | Same passage as Total shipments or sales | text | |
| wholesale|2015 | Ecommerce share | 26.5 % | E-Stats 2016 Table 2.1: U.S. Merchant Wholesale Trade Sales excluding manufacturers' sales branches and offices, Total and E-commerce (xls converted to CSV text) | Same passage as Total shipments or sales | text | |
| wholesale|2016 | Sector | Merchant wholesalers, except manufacturers' sales branches and offices | E-Stats 2017 Table 2.1: U.S. Merchant Wholesale Trade Sales excluding manufacturers' sales branches and offices, Total and E-commerce (xls converted to CSV text) | Table 2.1. U.S. Merchant Wholesale Trade Sales, Excluding Manufacturers' Sales Branches and Offices - Total and E-commerce: 2017 and 2016 | text | |
| wholesale|2016 | Year | 2016 | E-Stats 2017 Table 2.1: U.S. Merchant Wholesale Trade Sales excluding manufacturers' sales branches and offices, Total and E-commerce (xls converted to CSV text) | Same passage as Sector | text | |
| wholesale|2016 | Total shipments or sales | 5,228,485 USD million | E-Stats 2017 Table 2.1: U.S. Merchant Wholesale Trade Sales excluding manufacturers' sales branches and offices, Total and E-commerce (xls converted to CSV text) | 42.0,Total Merchant Wholesale Trade Excluding Manufacturers' Sales Branches and Offices,5557898.0,1541365.0,5228485.0,1452765.0,6.3,6.1,27.7,27.8,100.0 | text | |
| wholesale|2016 | Ecommerce shipments or sales | 1,452,765 USD million | E-Stats 2017 Table 2.1: U.S. Merchant Wholesale Trade Sales excluding manufacturers' sales branches and offices, Total and E-commerce (xls converted to CSV text) | Same passage as Total shipments or sales | text | |
| wholesale|2016 | Ecommerce share | 27.8 % | E-Stats 2017 Table 2.1: U.S. Merchant Wholesale Trade Sales excluding manufacturers' sales branches and offices, Total and E-commerce (xls converted to CSV text) | Same passage as Total shipments or sales | text | |
| wholesale|2017 | Sector | Merchant wholesalers, except manufacturers' sales branches and offices | E-Stats 2018 Table 2.1: U.S. Merchant Wholesale Trade Sales excluding manufacturers' sales branches and offices, Total and E-commerce (xls converted to CSV text) | Table 2.1. U.S. Merchant Wholesale Trade Sales, Excluding Manufacturers' Sales Branches and Offices - Total and E-commerce: 2018 and 2017 | text | |
| wholesale|2017 | Year | 2017 | E-Stats 2018 Table 2.1: U.S. Merchant Wholesale Trade Sales excluding manufacturers' sales branches and offices, Total and E-commerce (xls converted to CSV text) | Same passage as Sector | text | |
| wholesale|2017 | Total shipments or sales | 5,549,033 USD million | E-Stats 2018 Table 2.1: U.S. Merchant Wholesale Trade Sales excluding manufacturers' sales branches and offices, Total and E-commerce (xls converted to CSV text) | 42.0,Total Merchant Wholesale Trade Excluding Manufacturers' Sales Branches and Offices,5939442.0,1674992.0,5549033.0,1597417.0,7.0,4.9,28.2,28.8,100.0 | text | |
| wholesale|2017 | Ecommerce shipments or sales | 1,597,417 USD million | E-Stats 2018 Table 2.1: U.S. Merchant Wholesale Trade Sales excluding manufacturers' sales branches and offices, Total and E-commerce (xls converted to CSV text) | Same passage as Total shipments or sales | text | |
| wholesale|2017 | Ecommerce share | 28.8 % | E-Stats 2018 Table 2.1: U.S. Merchant Wholesale Trade Sales excluding manufacturers' sales branches and offices, Total and E-commerce (xls converted to CSV text) | Same passage as Total shipments or sales | text | |
| wholesale|2018 | Sector | Merchant wholesalers, except manufacturers' sales branches and offices | E-Stats 2019 Table 2.1: U.S. Merchant Wholesale Trade Sales excluding manufacturers' sales branches and offices, Total and E-commerce (xls converted to CSV text) | Table 2.1. U.S. Merchant Wholesale Trade Sales, Excluding Manufacturers' Sales Branches and Offices - Total and E-commerce: 2019 and 2018 | text | |
| wholesale|2018 | Year | 2018 | E-Stats 2019 Table 2.1: U.S. Merchant Wholesale Trade Sales excluding manufacturers' sales branches and offices, Total and E-commerce (xls converted to CSV text) | Same passage as Sector | text | |
| wholesale|2018 | Total shipments or sales | 6,099,945 USD million | E-Stats 2019 Table 2.1: U.S. Merchant Wholesale Trade Sales excluding manufacturers' sales branches and offices, Total and E-commerce (xls converted to CSV text) | 42.0,Total Merchant Wholesale Trade Excluding Manufacturers' Sales Branches and Offices,6087908.0,1771108.0,6099945.0,1722758.0,-0.2,2.8,29.1,28.2,100.0 | text | |
| wholesale|2018 | Ecommerce shipments or sales | 1,722,758 USD million | E-Stats Historical Table 2: Estimated E-Commerce Sales of U.S. Merchant Wholesalers 1992 through 2019 (converted to CSV text) | 42,E-commerce,Wholesale Trade,"Merchant Wholesalers, except manufacturers' sales branches and offices",1771108,1722758, | text | |
| wholesale|2018 | Ecommerce share | 28.2 % | E-Stats 2019 Table 2.1: U.S. Merchant Wholesale Trade Sales excluding manufacturers' sales branches and offices, Total and E-commerce (xls converted to CSV text) | Same passage as Total shipments or sales | text | |
| wholesale|2019 | Sector | Merchant wholesalers, except manufacturers' sales branches and offices | E-Stats 2019 Table 2.1: U.S. Merchant Wholesale Trade Sales excluding manufacturers' sales branches and offices, Total and E-commerce (xls converted to CSV text) | Table 2.1. U.S. Merchant Wholesale Trade Sales, Excluding Manufacturers' Sales Branches and Offices - Total and E-commerce: 2019 and 2018 | text | |
| wholesale|2019 | Year | 2019 | E-Stats 2019 Table 2.1: U.S. Merchant Wholesale Trade Sales excluding manufacturers' sales branches and offices, Total and E-commerce (xls converted to CSV text) | Same passage as Sector | text | |
| wholesale|2019 | Total shipments or sales | 6,087,908 USD million | E-Stats 2019 Table 2.1: U.S. Merchant Wholesale Trade Sales excluding manufacturers' sales branches and offices, Total and E-commerce (xls converted to CSV text) | 42.0,Total Merchant Wholesale Trade Excluding Manufacturers' Sales Branches and Offices,6087908.0,1771108.0,6099945.0,1722758.0,-0.2,2.8,29.1,28.2,100.0 | text | |
| wholesale|2019 | Ecommerce shipments or sales | 1,771,108 USD million | E-Stats Historical Table 2: Estimated E-Commerce Sales of U.S. Merchant Wholesalers 1992 through 2019 (converted to CSV text) | 42,E-commerce,Wholesale Trade,"Merchant Wholesalers, except manufacturers' sales branches and offices",1771108, | text | |
| wholesale|2019 | Ecommerce share | 29.1 % | E-Stats 2019 Table 2.1: U.S. Merchant Wholesale Trade Sales excluding manufacturers' sales branches and offices, Total and E-commerce (xls converted to CSV text) | Same passage as Total shipments or sales | text | |
| wholesale|2019 | Released | 2021-07-27 | E-Stats data tables page (multi-sector tables 1998 to 2019, last revised 2021-10-08) | July 27, 2021 | html | |
| wholesale|2020 | Sector | Merchant wholesalers, except manufacturers' sales branches and offices | AWTS 2022 revised Table 2: Estimated E-Commerce Sales of U.S. Merchant Wholesalers 1998 through 2022 (converted to CSV text) | 42,E-commerce,Wholesale Trade,"Merchant Wholesalers, except manufacturers' sales branches and… | text | |
| wholesale|2020 | Year | 2020 | AWTS 2022 revised Table 2: Estimated E-Commerce Sales of U.S. Merchant Wholesalers 1998 through 2022 (converted to CSV text) | 2022r,2021r,2020r | text | |
| wholesale|2020 | Ecommerce shipments or sales | 1,831,724 USD million | AWTS 2022 revised Table 2: Estimated E-Commerce Sales of U.S. Merchant Wholesalers 1998 through 2022 (converted to CSV text) | 42,E-commerce,Wholesale Trade,"Merchant Wholesalers, except manufacturers' sales branches and… | text | |
| wholesale|2021 | Sector | Merchant wholesalers, except manufacturers' sales branches and offices | AWTS 2022 revised Table 2: Estimated E-Commerce Sales of U.S. Merchant Wholesalers 1998 through 2022 (converted to CSV text) | 42,E-commerce,Wholesale Trade,"Merchant Wholesalers, except manufacturers' sales branches and… | html | |
| wholesale|2021 | Year | 2021 | AWTS 2022 revised Table 2: Estimated E-Commerce Sales of U.S. Merchant Wholesalers 1998 through 2022 (converted to CSV text) | 2022r,2021r,2020r | text | |
| wholesale|2021 | Ecommerce shipments or sales | 2,080,150 USD million | AWTS 2022 revised Table 2: Estimated E-Commerce Sales of U.S. Merchant Wholesalers 1998 through 2022 (converted to CSV text) | 42,E-commerce,Wholesale Trade,"Merchant Wholesalers, except manufacturers' sales branches and… | text | |
| wholesale|2021 | Released | 2023-05-25 | E-Stats 2021: Measuring the Electronic Economy (publication page, report E21-ESTATS) | May 25, 2023 | html | |
| wholesale|2022 | Sector | Merchant wholesalers, except manufacturers' sales branches and offices | AWTS 2022 revised Table 2: Estimated E-Commerce Sales of U.S. Merchant Wholesalers 1998 through 2022 (converted to CSV text) | 42,E-commerce,Wholesale Trade,"Merchant Wholesalers, except manufacturers' sales branches and… | html | |
| wholesale|2022 | Year | 2022 | AWTS 2022 revised Table 2: Estimated E-Commerce Sales of U.S. Merchant Wholesalers 1998 through 2022 (converted to CSV text) | 2022r,2021r,2020r | text | |
| wholesale|2022 | Ecommerce shipments or sales | 2,297,218 USD million | AWTS 2022 revised Table 2: Estimated E-Commerce Sales of U.S. Merchant Wholesalers 1998 through 2022 (converted to CSV text) | …Wholesalers, except manufacturers' sales branches and offices","2,297,218Q",2080150,1831724,1787747,1741976,1657644,1537379,1523339,1420450,1289345,… | text | |
| wholesale|2022 | Released | 2025-03-26 | E-Stats 2022: Measuring the Electronic Economy (publication page, report E22-ESTATS) | March 26, 2025 | html | |
| wholesale|2023 | Sector | Merchant wholesalers, except manufacturers' sales branches and offices | AIES 2023 Selected Sectors: E-commerce for Employer Firms in the U.S. (AIES00ECOM, pipe-delimited data plus field list, files dated 2026-09-08) | …States||42|42|Wholesale trade|805|1X|Merchant wholesalers, except manufacturers' sales branches and offices|00|All… | text | |
| wholesale|2023 | Year | 2023 | AIES 2023 Selected Sectors: E-commerce for Employer Firms in the U.S. (AIES00ECOM, pipe-delimited data plus field list, files dated 2026-09-08) | …trade|805|1X|Merchant wholesalers, except manufacturers' sales branches and offices|00|All establishments|2023|7851931148||2510139241||32||.6||.7||.2||2|| | text | |
| wholesale|2023 | Total shipments or sales | 7,851,931.148 USD million | AIES 2023 Selected Sectors: E-commerce for Employer Firms in the U.S. (AIES00ECOM, pipe-delimited data plus field list, files dated 2026-09-08) | …trade|805|1X|Merchant wholesalers, except manufacturers' sales branches and offices|00|All establishments|2023|7851931148||2510139241||32||.6||.7||.2||2|| | text | |
| wholesale|2023 | Ecommerce shipments or sales | 2,510,139.241 USD million | AIES 2023 Selected Sectors: E-commerce for Employer Firms in the U.S. (AIES00ECOM, pipe-delimited data plus field list, files dated 2026-09-08) | …trade|805|1X|Merchant wholesalers, except manufacturers' sales branches and offices|00|All establishments|2023|7851931148||2510139241||32||.6||.7||.2||2|| | text | |
| wholesale|2023 | Ecommerce share | 32 % | AIES 2023 Selected Sectors: E-commerce for Employer Firms in the U.S. (AIES00ECOM, pipe-delimited data plus field list, files dated 2026-09-08) | …trade|805|1X|Merchant wholesalers, except manufacturers' sales branches and offices|00|All establishments|2023|7851931148||2510139241||32||.6||.7||.2||2|| | text | |
| wholesale|2024 | Sector | Merchant wholesalers, except manufacturers' sales branches and offices | AIES 2024 Selected Sectors: E-commerce for Employer Firms in the U.S. (AIES00ECOM, pipe-delimited data plus field list, files dated 2026-09-08) | …States||42|42|Wholesale trade|805|1X|Merchant wholesalers, except manufacturers' sales branches and offices|00|All… | text | |
| wholesale|2024 | Year | 2024 | AIES 2024 Selected Sectors: E-commerce for Employer Firms in the U.S. (AIES00ECOM, pipe-delimited data plus field list, files dated 2026-09-08) | …trade|805|1X|Merchant wholesalers, except manufacturers' sales branches and offices|00|All establishments|2024|7989892343||2803127827||35.1||.6||.7||.2||2|| | text | |
| wholesale|2024 | Total shipments or sales | 7,989,892.343 USD million | AIES 2024 Selected Sectors: E-commerce for Employer Firms in the U.S. (AIES00ECOM, pipe-delimited data plus field list, files dated 2026-09-08) | …trade|805|1X|Merchant wholesalers, except manufacturers' sales branches and offices|00|All establishments|2024|7989892343||2803127827||35.1||.6||.7||.2||2|| | text | |
| wholesale|2024 | Ecommerce shipments or sales | 2,803,127.827 USD million | AIES 2024 Selected Sectors: E-commerce for Employer Firms in the U.S. (AIES00ECOM, pipe-delimited data plus field list, files dated 2026-09-08) | …trade|805|1X|Merchant wholesalers, except manufacturers' sales branches and offices|00|All establishments|2024|7989892343||2803127827||35.1||.6||.7||.2||2|| | text | |
| wholesale|2024 | Ecommerce share | 35.1 % | AIES 2024 Selected Sectors: E-commerce for Employer Firms in the U.S. (AIES00ECOM, pipe-delimited data plus field list, files dated 2026-09-08) | …trade|805|1X|Merchant wholesalers, except manufacturers' sales branches and offices|00|All establishments|2024|7989892343||2803127827||35.1||.6||.7||.2||2|| | text | |
| manufacturing|2015 | Released | 2018-05-24 | E-Stats data tables page (multi-sector tables 1998 to 2019, last revised 2021-10-08) | 2016 E-commerce Multi-sector Data Tables May 24, 2018 The following page has tables that provide information on selected characteristics of E-commerce data… | ruled | |
| manufacturing|2018 | Released | 2021-07-27 | E-Stats data tables page (multi-sector tables 1998 to 2019, last revised 2021-10-08) | July 27, 2021 The following page has tables that provide information on selected characteristics of E-commerce data for 2019. | ruled | |
| wholesale|2015 | Released | 2018-05-24 | E-Stats data tables page (multi-sector tables 1998 to 2019, last revised 2021-10-08) | 2016 E-commerce Multi-sector Data Tables May 24, 2018 The following page has tables that provide information on selected characteristics of E-commerce data… | ruled | |
| wholesale|2016 | Released | 2019-09-19 | E-Stats data tables page (multi-sector tables 1998 to 2019, last revised 2021-10-08) | 2017 E-commerce Multi-sector Data Tables September 19, 2019 The following page has tables that provide information on selected characteristics of E-commerce… | ruled | |
| wholesale|2017 | Released | 2020-05-13 | E-Stats data tables page (multi-sector tables 1998 to 2019, last revised 2021-10-08) | 2018 E-commerce Multi-sector Data Tables May 13, 2020 The following page has tables that provide information on selected characteristics of E-commerce data… | ruled | |
| wholesale|2018 | Released | 2021-07-27 | E-Stats data tables page (multi-sector tables 1998 to 2019, last revised 2021-10-08) | July 27, 2021 The following page has tables that provide information on selected characteristics of E-commerce data for 2019. | ruled | |
| manufacturing|2022 | Year | 2022 | Computed by Deploi | year = ; year from the row key manufacturing|2022 | computed | |
| manufacturing|2022 | Sector | Manufacturing | Computed by Deploi | sector = ; inputs manufacturing|2015.sector = Manufacturing; sector of manufacturing|2015, same sector in the row key | computed |
Methodology
Caveats: E-commerce share of US manufacturing shipments and merchant wholesale sales, 2015 to 2024
- Census counts orders placed over computer networks, including EDI, as e-commerce. These tables do not split EDI from web orders, so the share via EDI is empty for every row and the shares are not web-store shares.
- Each share is the one stated in the newest Census table that prints a share for that year: E-Stats editions of 2016 to 2019 for 2015 to 2019, the 2021 Annual Survey of Manufactures file for manufacturing in 2020 and 2021, and the Annual Integrated Economic Survey for 2023 and 2024.
- Wholesale 2015, 2016 and 2017 each come from the following year's E-Stats Table 2.1. Later Census tables restate wholesale e-commerce on the 2017 and 2022 Economic Census benchmarks but print no share, so the earlier wholesale years are not on the latest benchmark.
- No share is stated for wholesale in 2020 to 2022, where the Annual Wholesale Trade Survey gives e-commerce sales without a share and the dataset holds no total. The manufacturing 2022 row is empty. Census flags the 2022 wholesale e-commerce estimate for a 37.3% response rate and advises caution in drawing conclusions from it.
- From 2023 both sectors come from a different survey, so a change across the break mixes any real change with the change of survey.
- The release date is empty for 2020, 2023 and 2024 because the sources read do not state a release date for those values.
Deploi's charts and compilation are licensed CC BY 4.0. The underlying facts belong to their sources, which are named on every page. How Deploi Shopify Data works.
Sources
Tier A sources are primary documents: filings, official releases and official price pages. How sources are ranked.
Cite and reuse
Deploi's charts and compilation are licensed CC BY 4.0. The underlying facts belong to their sources, which are named on every page.
APA
Deploi. (2026). E-commerce share of US manufacturing shipments and merchant wholesale sales, 2015 to 2024 (Version 1) [Data set]. https://deploi.ca/shopify/data/datasets/us-b2b-ecommerce-share Retrieved November 19, 2026.
BibTeX
@misc{deploi_us_b2b_ecommerce_share_2026,
  author = {{Deploi}},
  title = {E-commerce share of US manufacturing shipments and merchant wholesale sales, 2015 to 2024},
  year = {2026},
  version = {1},
  url = {https://deploi.ca/shopify/data/datasets/us-b2b-ecommerce-share},
  note = {Accessed 2026-11-19}
}
Downloads
- Data: E-commerce share of US manufacturing shipments and merchant wholesale sales, 2015 to 2024 CSV
Changes
- · E-commerce share of US manufacturing shipments and merchant wholesale sales, 2015 to 2024
First published.