
What do published studies actually show about page speed and retail conversion, and how large are the effects?
Five published speed results state gains of 1% to 42% and only two come from controlled tests; Farfetch also estimates a 1.3% fall in conversion per extra 100 ms. Updated November 18, 2026.
By Martin DejnickiUpdated Data through 2022
Short answer
Five published speed results state gains of 1% to 42% for a faster site, according to Deloitte's 2020 report for Google and web.dev case studies retrieved November 18, 2026. A sixth, from Farfetch, estimates a 1.3% fall in conversion per extra 100 ms of largest contentful paint (LCP) beyond 2.5 seconds. Only two come from controlled tests, Vodafone's and Farfetch's A/B tests. Swappie's 42% is mobile revenue measured before and after.
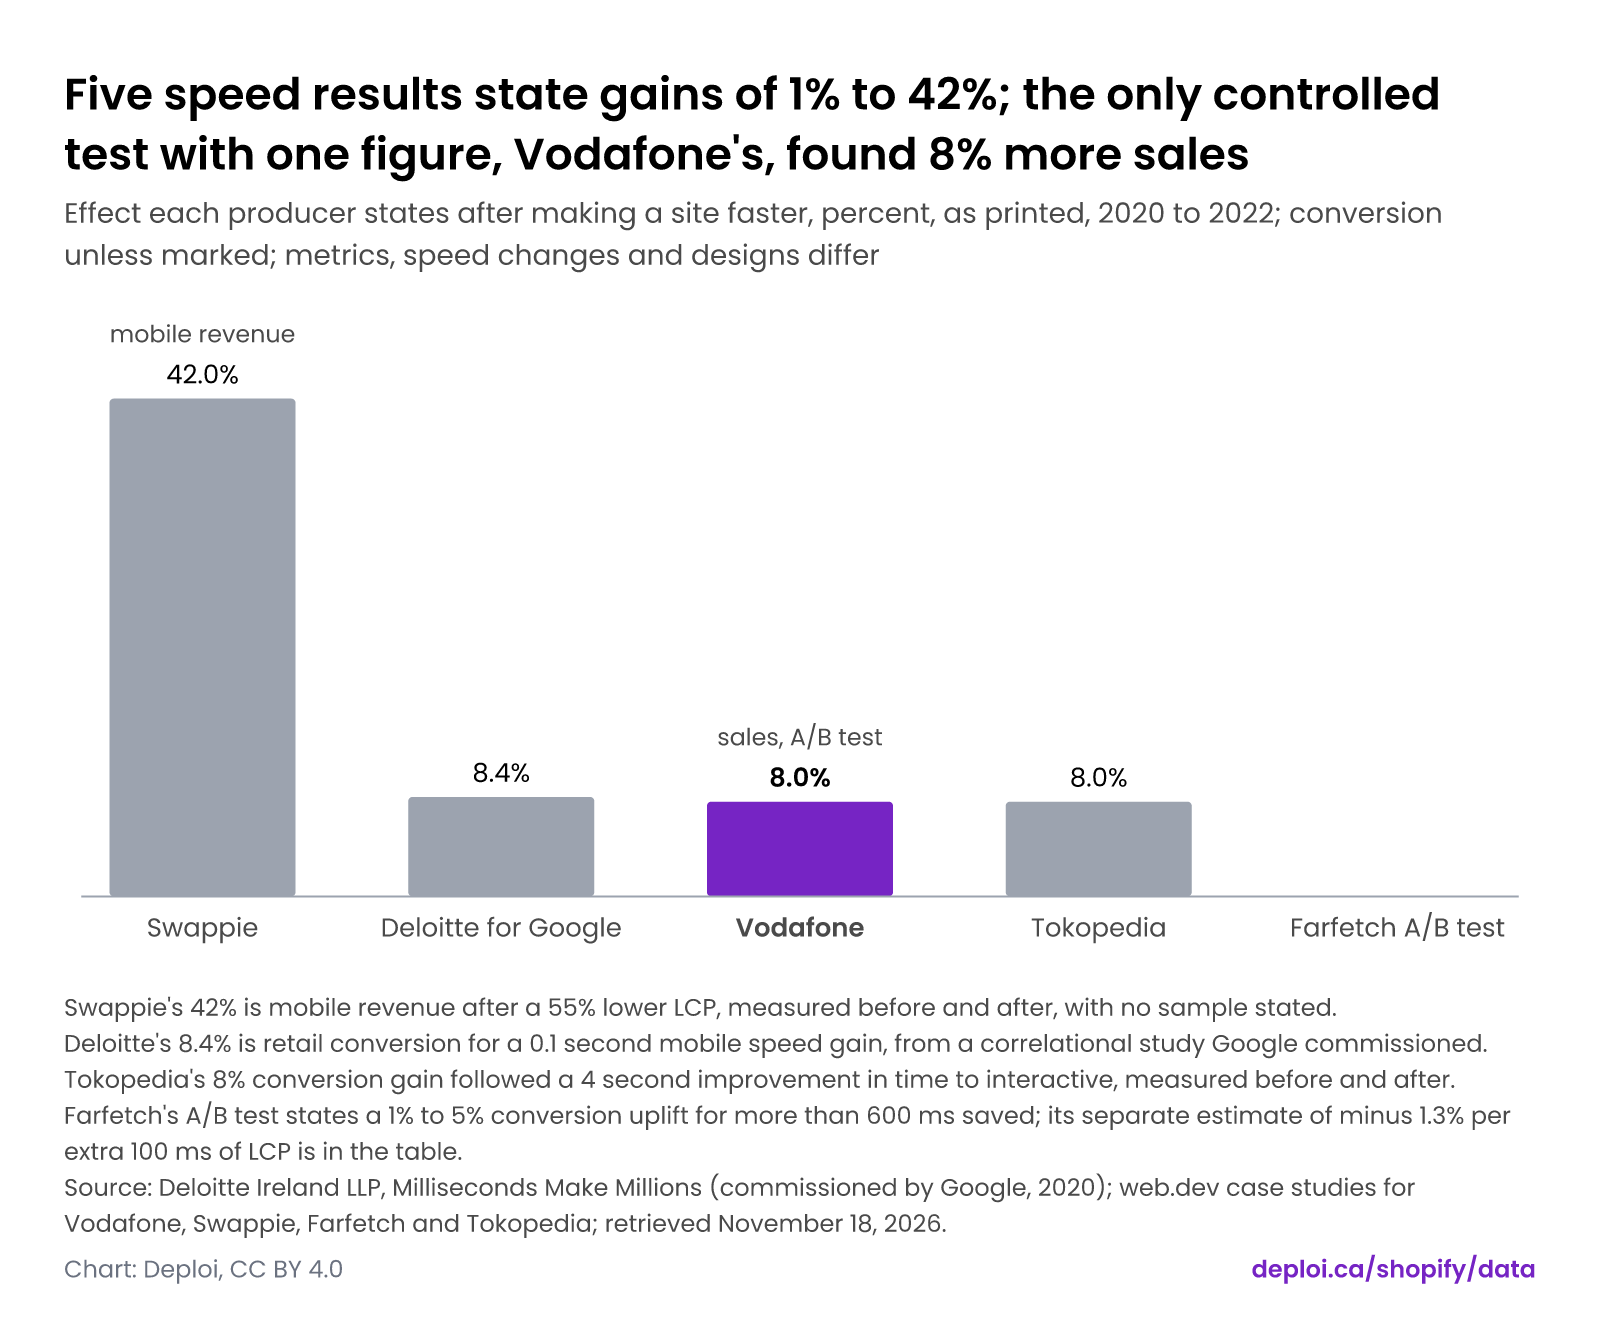
Five speed results state gains of 1% to 42%; the only controlled test with one figure, Vodafone's, found 8% more sales
Effect each producer states after making a site faster, percent, as printed, 2020 to 2022; conversion unless marked; metrics, speed changes and designs differ
- Swappie's 42% is mobile revenue after a 55% lower LCP, measured before and after, with no sample stated.
- Deloitte's 8.4% is retail conversion for a 0.1 second mobile speed gain, from a correlational study Google commissioned.
- Tokopedia's 8% conversion gain followed a 4 second improvement in time to interactive, measured before and after.
- Farfetch's A/B test states a 1% to 5% conversion uplift for more than 600 ms saved; its separate estimate of minus 1.3% per extra 100 ms of LCP is in the table.
Source: Deloitte Ireland LLP, Milliseconds Make Millions (commissioned by Google, 2020); web.dev case studies for Vodafone, Swappie, Farfetch and Tokopedia; retrieved November 18, 2026. Read on .
What this means for your decision
- Deciding whether a speed project is worth its cost? None of the six results predicts your gain, and the six are not a census of speed studies. They use different metrics and speed changes, and only 2 come from controlled tests: Vodafone's 8% more sales after a 31% LCP improvement and Farfetch's 1% to 5% conversion uplift after more than 600 ms saved. Size the case from your own conversion rate and traffic, and test on your own store.
- Quoting a headline figure? Name its metric and design. Swappie's 42% is mobile revenue measured before and after a 55% lower LCP, with no sample stated, and Tokopedia's 8% conversion gain is also a before and after result. Do not present either as a conversion lift that speed alone caused.
- Citing Deloitte's 8.4%? It is a correlational result from a 2020 report Google commissioned, covering 37 brands and 30 million sessions over four weeks in 2019, for a 0.1 second mobile speed improvement. Cite it as an association, not as what 0.1 second will earn your store.
- Using the 1.3% per 100 ms figure? It is Farfetch's correlational estimate for its own site, per extra 100 ms of LCP beyond the 2.5 second threshold, with no sample stated, on a case page last updated July 12, 2022. It measures a slower page, so do not add it to the 1% to 42% gains. Treat it as one retailer's estimate, not a rate for your store.
What effect do the published studies state for a faster site?
The published results state a 42% rise in mobile revenue for Swappie, an 8.4% rise in retail conversion for Deloitte's 0.1 second gain, an 8% rise in sales for Vodafone, an 8% rise in conversion for Tokopedia and a 1% to 5% conversion uplift for Farfetch, according to Deloitte's 2020 report and web.dev case studies. Metrics and speed changes differ.
Each effect is quoted as the producer prints it, with its own metric and its own speed change. The bars are not a like-for-like comparison.
The studies date from 2020 to 2022. Years are publication years for Deloitte's report and Vodafone's case. The Swappie, Farfetch and Tokopedia case pages print no publication date, so the year shown is the year each page was last updated.
Which published speed results come from controlled tests?
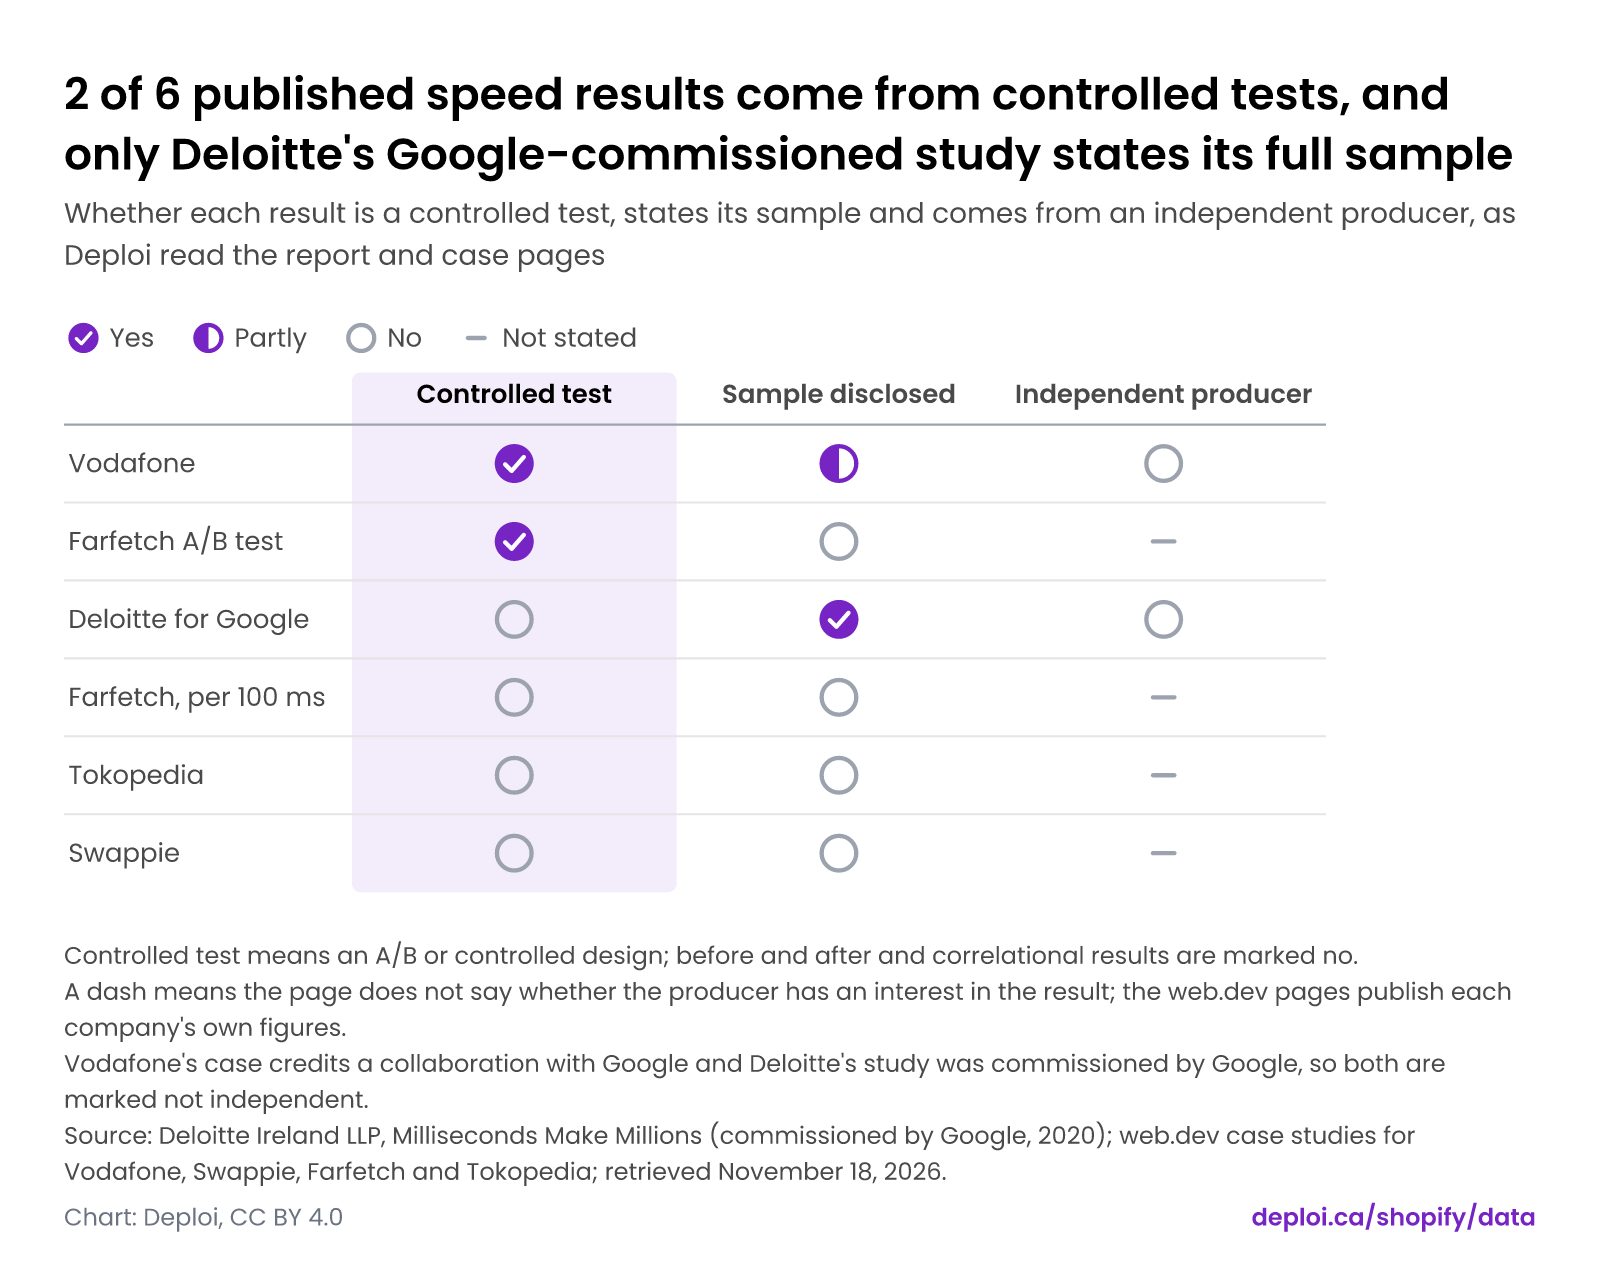
Two of the six results come from controlled tests: Vodafone's A/B test and Farfetch's A/B test, according to Deploi's reading of the report and case pages retrieved November 18, 2026. Only Deloitte's Google-commissioned study states its full sample. Swappie and Tokopedia are before and after comparisons, and Deloitte and Farfetch's per-100 ms estimate are correlational.
The matrix tests three things: whether the design is a controlled test, whether the sample is stated and whether the producer is independent. Vodafone's case credits a collaboration with Google and Deloitte's study was commissioned by Google, so both are marked not independent.
A dash means the page does not say whether the producer has an interest in the result. The web.dev pages publish each company's own figures.
2 of 6 published speed results come from controlled tests, and only Deloitte's Google-commissioned study states its full sample
Whether each result is a controlled test, states its sample and comes from an independent producer, as Deploi read the report and case pages
- Controlled test means an A/B or controlled design; before and after and correlational results are marked no.
- A dash means the page does not say whether the producer has an interest in the result; the web.dev pages publish each company's own figures.
- Vodafone's case credits a collaboration with Google and Deloitte's study was commissioned by Google, so both are marked not independent.
Source: Deloitte Ireland LLP, Milliseconds Make Millions (commissioned by Google, 2020); web.dev case studies for Vodafone, Swappie, Farfetch and Tokopedia; retrieved November 18, 2026. Read on .
Does a 0.1 second faster site lift conversion by 8.4%?
Deloitte's Milliseconds Make Millions, a 2020 report Google commissioned, reports retail conversions up 8.4% and average order value up 9.2% for a 0.1 second mobile speed improvement. It is a correlational study of 37 brands and 30 million sessions over four weeks, so it shows an association, not that faster pages caused the lift.
Deloitte prepared the report from data collected and analyzed by Fifty-Five, which Google recruited directly. The sample ran from October 28 to November 24, 2019, mainly in Europe and the US. The retail results rest on 20.5 million of the sessions, from 15 retail brands.
The report describes the 0.1 second change in more than one way. The page uses the wording the retail result uses: a natural mobile site speed improvement.
What did the controlled tests find?
Vodafone's A/B test found 8% more sales after a 31% improvement in LCP, with both versions getting around 100K clicks and 34K visits per day, according to its web.dev case study. Farfetch's A/B test found a conversion uplift of 1% to 5% after shaving more than 600 ms off product pages, and states no sample.
Both tests were run by the company itself and published on web.dev. Vodafone's case credits a collaboration with Google. Farfetch's page says the uplift came "with the company's defined confidence level" and gives no sample.
Controlled design is the strongest evidence in this set. Two tests are still a thin base for a general rule.
Is Swappie's 42% a conversion effect?
No. Swappie's 42% is a rise in mobile revenue measured before and after a 55% lower LCP, according to its web.dev case study, and the page states no sample. The closest conversion measure it reports is mobile conversion rate as a share of desktop conversion rate, which went from 24% to 34%. It is not a controlled test.
Swappie also reports a 23% lower average page load time, a 91% lower CLS and a 90% lower FID. Several things changed at once, so the revenue rise cannot be tied to LCP alone.
Swappie set up the tracking and its development team did the optimization.
How much conversion does each extra 100 ms cost?
Farfetch's web.dev case study states that conversion falls on average 1.3% with each additional 100 ms of LCP beyond the 2.5 second threshold. It is a correlational estimate from Farfetch's own data, with no sample stated, on a case page last updated July 12, 2022. It is separate from the company's A/B test.
The estimate is the only per-100 ms figure in the dataset. It is a decrease in conversion for a slower page, while the other results are increases for a faster one, so it is stored in the table and not drawn as a bar.
A correlational result does not show that speed caused the change.
Can these studies justify the cost of a speed project?
Not for one store. The six results use different metrics, conversion, sales and mobile revenue, and different speed changes, 0.1 second, 31% LCP, 4 seconds of time to interactive and 600 ms, and only 2 are controlled tests, according to the sources retrieved November 18, 2026. They show that effects have been reported, not what a given store would gain.
A speed project's case rests on a store's own baseline, traffic and conversion rate. The studies can help choose what to test first.
The direct evidence is a test on your own store. For page weight, see Deploi's page on how much JavaScript and how many image bytes a Shopify page ships.
The data
Each chart on this page is drawn from the numbers below. Units are in the column headers.
Five speed results state gains of 1% to 42%; the only controlled test with one figure, Vodafone's, found 8% more sales
| Study (short) | Stated effect (%) | Effect as printed | Metric | Speed change | Design | Producer | Sponsor | Year |
|---|---|---|---|---|---|---|---|---|
| Deloitte for Google | 8.4 | Retail conversions increased by 8.4% and average order value increased by 9.2%. | conversion (retail: users that transacted); average order value, page views per session, bounce rate and funnel progression also reported | 0.1s natural mobile site speed improvement | correlational | Deloitte Ireland LLP prepared the report, based on data and statistical information provided by Fifty-Five (recruited directly by Google to collect and analyse the statistical data) | 2020 | |
| Vodafone | 8.0 | An 8% increase in sales | sales (also lead to visit rate and cart to visit rate) | 31% improvement in LCP (field data, version A vs version B) | controlled test | Vodafone (ran the A/B test); published on web.dev | 2021 | |
| Swappie | 42.0 | Rel mCvR went from 24% to 34% and mobile revenue had increased 42%! | mobile revenue (Rel mCvR, mobile conversion rate divided by desktop conversion rate, also reported) | 55% lower LCP; 23% lower average page load time; 91% lower CLS; 90% lower FID | before and after | Swappie (set up the tracking; its development team did the optimization); published on web.dev | 2021 | |
| Farfetch A/B test | Range only | On product pages for example, this effort shaved off more than 600ms, and the A/B test showed an uplift on conversion rate in the range of 1-5% with the company's defined confidence level. | conversion | more than 600ms shaved off on product pages (from work to improve LCP) | controlled test | Farfetch | 2022 | |
| Farfetch, per 100 ms | -1.3 | This shows that users really start to feel the downside of a slow page load perception and conversion rate decreases on average -1.3% with each 100ms more of LCP. | conversion | each 100ms more of LCP, beyond the 2.5 second LCP threshold | correlational | Farfetch | 2022 | |
| Tokopedia | 8.0 | an 8% increase in conversions (CVR) | conversion (CVR) | 4sec improvement in TTI | before and after | Tokopedia | 2020 |
Download Published studies on page speed and retail conversion: effects, samples and producers as CSV · All 15 columns on the dataset page
2 of 6 published speed results come from controlled tests, and only Deloitte's Google-commissioned study states its full sample
| Study | Controlled test (yes or no) | Sample disclosed (yes, partly or no) | Independent producer (yes or no) | Design | Producer | Sponsor | Year |
|---|---|---|---|---|---|---|---|
| Vodafone | Yes | Partly | No | controlled test | Vodafone (ran the A/B test); published on web.dev | 2021 | |
| Farfetch A/B test | Yes | No | Not stated | controlled test | Farfetch | 2022 | |
| Deloitte for Google | No | Yes | No | correlational | Deloitte Ireland LLP prepared the report, based on data and statistical information provided by Fifty-Five (recruited directly by Google to collect and analyse the statistical data) | 2020 | |
| Farfetch, per 100 ms | No | No | Not stated | correlational | Farfetch | 2022 | |
| Tokopedia | No | No | Not stated | before and after | Tokopedia | 2020 | |
| Swappie | No | No | Not stated | before and after | Swappie (set up the tracking; its development team did the optimization); published on web.dev | 2021 |
Download Published studies on page speed and retail conversion: effects, samples and producers as CSV · All 15 columns on the dataset page
Methodology
Reading the chart: Five speed results state gains of 1% to 42%; the only controlled test with one figure, Vodafone's, found 8% more sales
- Swappie's 42% is mobile revenue after a 55% lower LCP, measured before and after, with no sample stated.
- Deloitte's 8.4% is retail conversion for a 0.1 second mobile speed gain, from a correlational study Google commissioned.
- Tokopedia's 8% conversion gain followed a 4 second improvement in time to interactive, measured before and after.
- Farfetch's A/B test states a 1% to 5% conversion uplift for more than 600 ms saved; its separate estimate of minus 1.3% per extra 100 ms of LCP is in the table.
Reading the chart: 2 of 6 published speed results come from controlled tests, and only Deloitte's Google-commissioned study states its full sample
- Controlled test means an A/B or controlled design; before and after and correlational results are marked no.
- A dash means the page does not say whether the producer has an interest in the result; the web.dev pages publish each company's own figures.
- Vodafone's case credits a collaboration with Google and Deloitte's study was commissioned by Google, so both are marked not independent.
Caveats: Published studies on page speed and retail conversion: effects, samples and producers
- The set is retail and ecommerce speed cases that report a conversion, sales or revenue effect. It is not a census of speed studies.
- Metrics and speed changes differ between rows, so the effects are not like for like. Swappie's 42% is mobile revenue, not conversion. Farfetch has two rows: an A/B test with a 1% to 5% range and no single figure, and a separate correlational estimate of minus 1.3% per additional 100 ms of LCP beyond the 2.5 second threshold.
- Deloitte's report was commissioned by Google. It is correlational, covers 37 brands and 30 million sessions over four weeks in 2019, and describes the 0.1 second change in more than one way. The retail results rest on 20.5 million sessions.
- Controlled test is yes for an A/B or controlled design and no for before and after or correlational results. Independent is no when a vendor with an interest produced or sponsored the study: Deloitte, and Vodafone, whose case credits a collaboration with Google. The other web.dev cases name no Google role in the study, and whether Google publishing them counts as sponsorship is undecided, so their independence is empty.
- Year is the publication year or, where the case page prints no publication date, the year of its Last updated date (Farfetch: last updated July 12, 2022).
- Effects are as printed by the producer, with the sign as printed. Where a page gives only a range, the effect column is empty and the range stays in the printed text.
Deploi's charts and compilation are licensed CC BY 4.0. The underlying facts belong to their sources, which are named on every page. How Deploi Shopify Data works.
Sources
Tier A sources are primary documents: filings, official releases and official price pages. How sources are ranked.
Show all 9 sources
- Tier DMilliseconds Make Millions | Deloitte Ireland
Deloitte Ireland LLP · HTML · Read on
- Tier DMilliseconds Make Millions (full report, PDF, 51 pages)
Deloitte Ireland LLP · PDF · Read on
- Tier AAgrofy: A 70% improvement in LCP correlated to a 76% reduction in load abandonment | web.dev
Google (web.dev) · HTML · Read on
- Tier AAliExpress | web.dev case study
Google (web.dev) · HTML · Read on
- Tier ALuxury retailer Farfetch sees higher conversion rates for better Core Web Vitals | web.dev
Google (web.dev) · HTML · Read on
- Tier ARakuten 24's investment in PWA increases user retention by 450% | web.dev
Google (web.dev) · HTML · Read on
- Tier AHow Swappie increased mobile revenue by 42% by focusing on Core Web Vitals | web.dev
Google (web.dev) · HTML · Read on
- Tier AHow focusing on web performance improved Tokopedia's click-through rate by 35% | web.dev
Google (web.dev) · HTML · Read on
- Tier AVodafone: A 31% improvement in LCP increased sales by 8% | web.dev
Google (web.dev) · HTML · Read on
Cite and reuse
Deploi's charts and compilation are licensed CC BY 4.0. The underlying facts belong to their sources, which are named on every page.
APA
Deploi. (2026). What do published studies actually show about page speed and retail conversion, and how large are the effects? [Web page]. https://deploi.ca/shopify/data/page-speed-conversion-studies Retrieved November 18, 2026.
BibTeX
@misc{deploi_page_speed_conversion_studies_2026,
  author = {{Deploi}},
  title = {What do published studies actually show about page speed and retail conversion, and how large are the effects?},
  year = {2026},
  url = {https://deploi.ca/shopify/data/page-speed-conversion-studies},
  note = {Accessed 2026-11-18}
}
Embed a chart
Embed: Five speed results state gains of 1% to 42%; the only controlled test with one figure, Vodafone's, found 8% more sales
Embed code
<iframe src="https://deploi.ca/embed/shopify/data/speed-study-effects" title="Five speed results state gains of 1% to 42%; the only controlled test with one figure, Vodafone's, found 8% more sales" loading="lazy" style="width:100%;height:550px;border:0"></iframe> <p style="font:12px/1.4 Arial,sans-serif;margin:4px 0 0">Source: <a href="https://deploi.ca/shopify/data/page-speed-conversion-studies#chart-speed-study-effects">Deploi, Five speed results state gains of 1% to 42%; the only controlled test with one figure, Vodafone's, found 8% more sales</a></p>
Embed: 2 of 6 published speed results come from controlled tests, and only Deloitte's Google-commissioned study states its full sample
Embed code
<iframe src="https://deploi.ca/embed/shopify/data/speed-study-evidence-matrix" title="2 of 6 published speed results come from controlled tests, and only Deloitte's Google-commissioned study states its full sample" loading="lazy" style="width:100%;height:540px;border:0"></iframe> <p style="font:12px/1.4 Arial,sans-serif;margin:4px 0 0">Source: <a href="https://deploi.ca/shopify/data/page-speed-conversion-studies#chart-speed-study-evidence-matrix">Deploi, 2 of 6 published speed results come from controlled tests, and only Deloitte's Google-commissioned study states its full sample</a></p>
Keep the credit line under the embed. It is the license condition.
Downloads
- Chart: Five speed results state gains of 1% to 42%; the only controlled test with one figure, Vodafone's, found 8% more sales PNG
- Chart: 2 of 6 published speed results come from controlled tests, and only Deloitte's Google-commissioned study states its full sample PNG
- Data: Published studies on page speed and retail conversion: effects, samples and producers CSV
Questions
Does page speed really affect conversion?
Five of six published results report gains of 1% to 42% for a faster site, depending on metric and speed change, per Deloitte's 2020 report and web.dev case studies. The sixth, Farfetch's, estimates a 1.3% fall in conversion per extra 100 ms of LCP beyond 2.5 seconds. Only two come from controlled tests, Vodafone's 8% sales rise and Farfetch's 1% to 5% conversion uplift.
What did Deloitte's Milliseconds Make Millions find?
Deloitte's 2020 report, commissioned by Google, found retail conversions up 8.4% and average order value up 9.2% for a 0.1 second mobile speed gain, across 37 brands and 30 million sessions. The study is correlational, so it does not show cause.
What did Vodafone's speed test find?
Vodafone's A/B test found 8% more sales after a 31% improvement in LCP, with each version getting around 100K clicks and 34K visits per day, per its web.dev case study published in 2021. Vodafone ran the test.
Is the 42% Swappie result about conversion?
No. It is mobile revenue measured before and after a 55% lower LCP, per Swappie's web.dev case study. Its mobile conversion rate as a share of its desktop rate went from 24% to 34%. The page states no sample and the design is not a controlled test.
How much conversion does a slower page lose?
Farfetch's web.dev case study states an average decrease of 1.3% in conversion with each additional 100 ms of LCP beyond the 2.5 second threshold. It is a correlational estimate with no sample stated, on a case page last updated July 12, 2022.
More on Performance and technology
- How much Canadian and US web traffic comes from Safari and Firefox, which have built-in tracking protection?
Safari and Firefox made up 39.4% of Canadian page views in October 2026, against 31.8% in the US, per Statcounter Global Stats, with the sums computed by Deploi. Updated November 19, 2026.
- How much JavaScript and how many image bytes does a Shopify page ship compared with other platforms?
Shopify's median mobile page ships 1,549 KB of JavaScript, second only to Wix among the six platforms charted and 2.7 times WordPress, and 762 KB of images, in the HTTP Archive Web Almanac 2025 CMS results. The dataset holds no earlier Shopify figure, so growth cannot be shown. Updated November 19, 2026.
- What are Shopify's platform limits, and which are higher on Plus?
Plus raises 5 of the 18 Shopify limits compared and has no cap on 2 more; the other 11, including 2,048 variants and 3 options per product, are the same on every plan, per Shopify's Help Center and shopify.dev read November 19, 2026. Updated November 19, 2026.
- How often does Hydrogen ship releases and breaking changes, and how long do older versions stay supported?
Hydrogen published 9 stable releases in 2025 and 34 in 2024, then 14 in the first quarter of 2026, according to npm publish dates read November 18, 2026. Of 12 majors with a stated API version, 3 still targeted a supported Storefront API version on that date. Updated November 18, 2026.
- How do the agentic commerce protocols compare on launch dates, backers, surfaces and merchant requirements?
UCP, ACP, Shopify Catalog and Shopify Agentic Storefronts launched between May 21, 2025 and January 11, 2026; ACP listed 5 spec versions and UCP 4 on October 18, 2026. Updated October 19, 2026.
- Which Shopify deprecations and deadlines land in the next 12 months, and which have already passed?
Five dated Shopify deadlines in Deploi's dataset fall in the next 12 months, from January 16 to October 16, 2027; the other 12 have passed. Updated October 19, 2026.
Changes
- · Published studies on page speed and retail conversion: effects, samples and producers
First published.