
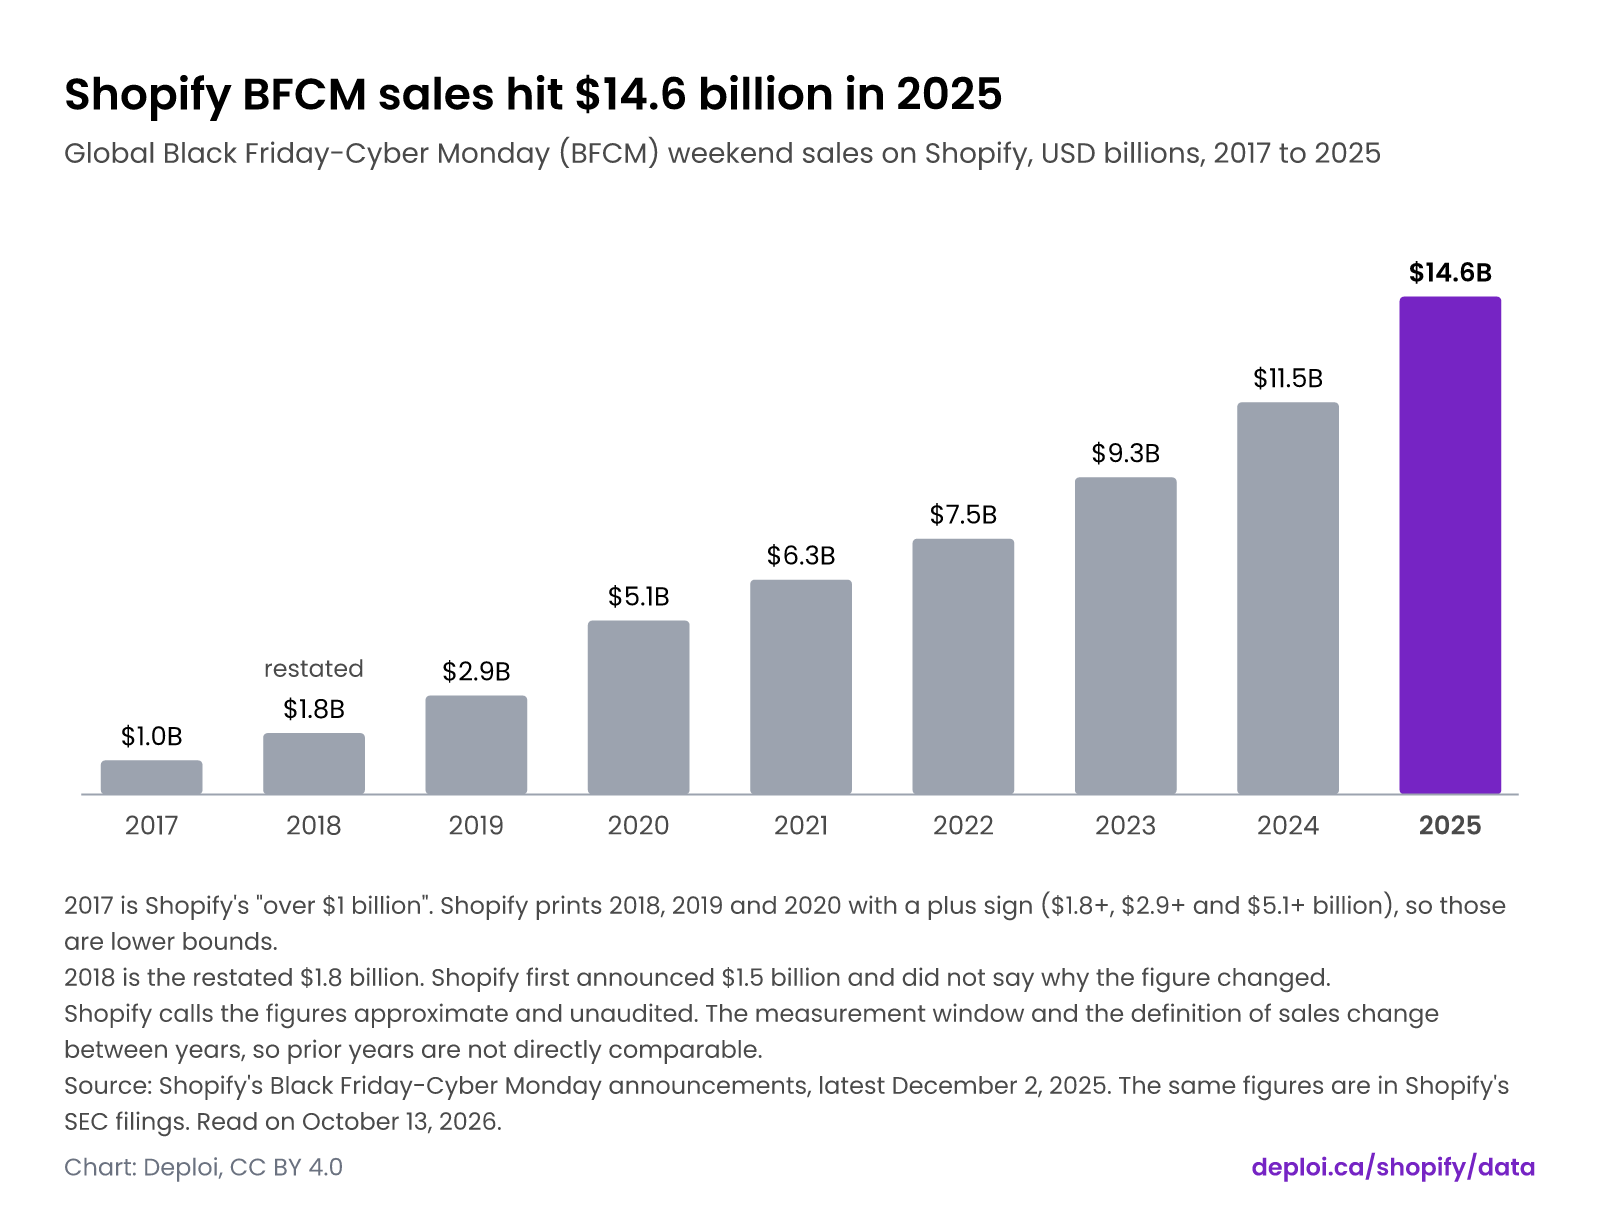
Shopify BFCM sales hit $14.6 billion in 2025
Global Black Friday-Cyber Monday (BFCM) weekend sales on Shopify, USD billions, 2017 to 2025
By Martin DejnickiUpdated Data through 2025
Short answer
Shopify merchants sold $14.6 billion worldwide over Black Friday-Cyber Monday weekend 2025, up 27% from $11.5 billion in 2024. Shopify announced the total on December 2, 2025. Sales have risen every year since the $1 billion reported for 2017. Shopify calls its figures approximate and unaudited, and the measurement window changes by year.
Shopify BFCM sales hit $14.6 billion in 2025
Global Black Friday-Cyber Monday (BFCM) weekend sales on Shopify, USD billions, 2017 to 2025
- 2017 is Shopify's "over $1 billion". Shopify prints 2018, 2019 and 2020 with a plus sign ($1.8+, $2.9+ and $5.1+ billion), so those are lower bounds.
- 2018 is the restated $1.8 billion. Shopify first announced $1.5 billion and did not say why the figure changed.
- Shopify calls the figures approximate and unaudited. The measurement window and the definition of sales change between years, so prior years are not directly comparable.
Source: Shopify's Black Friday-Cyber Monday announcements, latest December 2, 2025. The same figures are in Shopify's SEC filings. Read on .
The data
Each chart on this page is drawn from the numbers below. Units are in the column headers.
| Year | BFCM sales (USD billion) | Sales as stated | Growth as stated (%) |
|---|---|---|---|
| 2017 | 1.0 | over $1 billion | Not stated |
| 2018 | 1.8 | $1.8+ billion | Not stated |
| 2019 | 2.9 | $2.9+ billion | Not stated |
| 2020 | 5.1 | $5.1+ billion | 76 |
| 2021 | 6.3 | $6.3 billion | 23 |
| 2022 | 7.5 | $7.5 billion | 19 |
| 2023 | 9.3 | $9.3 billion | 24 |
| 2024 | 11.5 | $11.5 billion | 24 |
| 2025 | 14.6 | $14.6 billion | 27 |
Download Shopify Black Friday-Cyber Monday sales by year as CSV · All 19 columns on the dataset page
Methodology
Reading the chart: Shopify BFCM sales hit $14.6 billion in 2025
- 2017 is Shopify's "over $1 billion". Shopify prints 2018, 2019 and 2020 with a plus sign ($1.8+, $2.9+ and $5.1+ billion), so those are lower bounds.
- 2018 is the restated $1.8 billion. Shopify first announced $1.5 billion and did not say why the figure changed.
- Shopify calls the figures approximate and unaudited. The measurement window and the definition of sales change between years, so prior years are not directly comparable.
Caveats: Shopify Black Friday-Cyber Monday sales by year
- Shopify calls the figures approximate and unaudited. The 2017 page says: "All data presented here is approximate and is based on various assumptions. All data is unaudited and is subject to adjustment." The 2023 to 2025 releases add that the methodology "may vary year on year and prior year results are not directly comparable to current results." Treat year-over-year comparisons as indicative.
- Shopify does not define sales before 2023. From 2023 it defines sales as gross merchandise volume (GMV), covering online and offline sales: the total dollar value of orders on the platform, net of refunds and inclusive of shipping and handling, duty and value-added taxes. GMV is not Shopify revenue and not merchants' net sales.
- The measurement window changes by year. The 2017 and 2018 pages give dates without a time zone. The 2019 and 2020 windows run from UTC+13 to Pacific time. The 2021 to 2023 windows run from Thursday 11:00 UTC to Tuesday 08:00 UTC. The 2024 and 2025 releases say only "early Friday in New Zealand to late Monday in California". Black Friday falls on a different date each year, so the windows are not identical spans.
- 2018 was restated. Shopify first announced "over $1.5 billion" and later called it $1.8+ billion in its 2019 release and its Q4 2019 results release, without giving a reason. The column salesUsdB holds the latest stated value (1.8) and originalSalesUsdB the first-announced value (1.5).
- Growth rates are Shopify's own stated percentages, in nominal US dollars unless the constant-currency column is filled (2022: 21%, 2025: 24%). The 2017 to 2019 releases state none. Deploi recomputed each stated rate from the stated levels, and every one agrees within one percentage point, the size of the rounding in Shopify's levels.
- Buyer counts are not like for like. The 2019 count uses an Eastern time window, the 2025 count is "based on unique buyer emails", and the 2022 consumer-growth percentage was corrected from 18% to 12% in a Form 6-K/A filed the same day. The 2017 and 2018 releases state merchant counts only, not buyers.
- Stated levels carry qualifiers: "over" (2017, and 2018 as first announced), a plus sign (2019, 2020 and 2018 as restated) or none (2021 to 2025). Treat qualified values as lower bounds.
- SEC coverage. Each of 2020 to 2025 has a dedicated BFCM exhibit (Form 6-K, then Form 8-K from 2025). For 2017, 2018 and 2019 Shopify filed no standalone BFCM release, so the SEC copy of the figure is in the following February's Q4 results release. Shopify's Q4 2016 release gives no dollar total for BFCM 2016, so 2017 is the first dollar figure.
- Where an SEC exhibit and Shopify's page differ in wording or typos, the page supplies the fields; the sales figure agrees between the two for every year. Example: the 2024 exhibit reads "116,500+" first-sale entrepreneurs where the page reads "16,500+". Black Friday-day-only announcements and interim updates are not weekend totals and are excluded. All sales figures are US dollars, and the pages were read on October 13, 2026.
Deploi's charts and compilation are licensed CC BY 4.0. The underlying facts belong to their sources, which are named on every page. How Deploi Shopify Data works.
Sources
Tier A sources are primary documents: filings, official releases and official price pages. How sources are ranked.
Show all 21 sources
- Tier AOver $1 Billion Sold By Shopify Merchants During Black Friday and Cyber Monday Weekend (2017-11-28)
Shopify Inc. · HTML · Read on
- Tier ABlack Friday Cyber Monday 2018: An Analysis of Over $1.5 Billion in Sales (Shopify blog, 2018-11-28)
Shopify Inc. · HTML · Read on
- Tier A
- Tier A
- Tier A
- Tier AShopify Merchants Set New Black Friday Cyber Monday Record with $7.5 Billion in Sales (2022-11-29)
Shopify Inc. · HTML · Read on
- Tier AShopify merchants drive record-high $9.3 billion in Black Friday-Cyber Monday sales (2023-11-28)
Shopify Inc. · HTML · Read on
- Tier A
- Tier AShopify merchants generate record-breaking $14.6 billion in Black Friday Cyber Monday sales (2025-12-02)
Shopify Inc. · HTML · Read on
- Tier AShopify Inc., Q4 and full-year 2017 results press release (Form 6-K, Exhibit 99.1), filed 2018-02-15
Shopify Inc. · HTML · Read on
- Tier AShopify Inc., Q4 and full-year 2018 results press release (Form 6-K, Exhibit 99.1), filed 2019-02-12
Shopify Inc. · HTML · Read on
- Tier AShopify Inc., Q4 and full-year 2019 results press release (Form 6-K, Exhibit 99.1), filed 2020-02-12
Shopify Inc. · HTML · Read on
- Tier AForm 6-K Ex. 99.1, BFCM 2020 results press release (filed 2020-12-01)
Shopify Inc. · HTML · Read on
- Tier AForm 6-K Ex. 99.1, BFCM 2021 results press release (filed 2021-11-30)
Shopify Inc. · HTML · Read on
- Tier AForm 6-K/A Ex. 99.1, BFCM 2022 results press release, amended (filed 2022-11-29)
Shopify Inc. · HTML · Read on
- Tier AForm 6-K Ex. 99.1, BFCM 2022 results press release, original before amendment (filed 2022-11-29)
Shopify Inc. · HTML · Read on
- Tier AForm 6-K Ex. 99.1, BFCM 2023 results press release (filed 2023-11-28)
Shopify Inc. · HTML · Read on
- Tier AForm 6-K Ex. 99.1, BFCM 2024 results press release (filed 2024-12-03)
Shopify Inc. · HTML · Read on
- Tier AForm 8-K Ex. 99.1, BFCM 2025 results press release (filed 2025-12-02)
Shopify Inc. · HTML · Read on
- Tier AShopify Inc., Q4 and full-year 2016 results press release (Form 6-K, Exhibit 99.1), filed 2017-02-15
Shopify Inc. · HTML · Read on
- Tier ASEC EDGAR submissions index for Shopify Inc. (CIK 0001594805)
U.S. Securities and Exchange Commission (EDGAR) · API · Read on
Cite and reuse
Deploi's charts and compilation are licensed CC BY 4.0. The underlying facts belong to their sources, which are named on every page.
APA
Deploi. (2026). Shopify BFCM sales hit $14.6 billion in 2025 (Version 1) [Chart]. https://deploi.ca/shopify/data/charts/shopify-bfcm-sales-by-year Retrieved October 13, 2026.
BibTeX
@misc{deploi_shopify_bfcm_sales_by_year_2026,
  author = {{Deploi}},
  title = {Shopify BFCM sales hit \$14.6 billion in 2025},
  year = {2026},
  version = {1},
  url = {https://deploi.ca/shopify/data/charts/shopify-bfcm-sales-by-year},
  note = {Accessed 2026-10-13}
}
Embed this chart
Embed code
<iframe src="https://deploi.ca/embed/shopify/data/shopify-bfcm-sales-by-year" title="Shopify BFCM sales hit $14.6 billion in 2025" loading="lazy" style="width:100%;height:550px;border:0"></iframe>
<p style="font:12px/1.4 Arial,sans-serif;margin:4px 0 0">Source: <a href="https://deploi.ca/shopify/data/charts/shopify-bfcm-sales-by-year">Deploi, Shopify BFCM sales hit $14.6 billion in 2025</a></p>
Keep the credit line under the embed. It is the license condition.
Changes
- · Shopify Black Friday-Cyber Monday sales by year
First release. Nine years (2017 to 2025) read from Shopify's announcement pages and checked against its SEC filings. The 2018 restatement and a 2022 correction to the consumer-growth figure are recorded.