
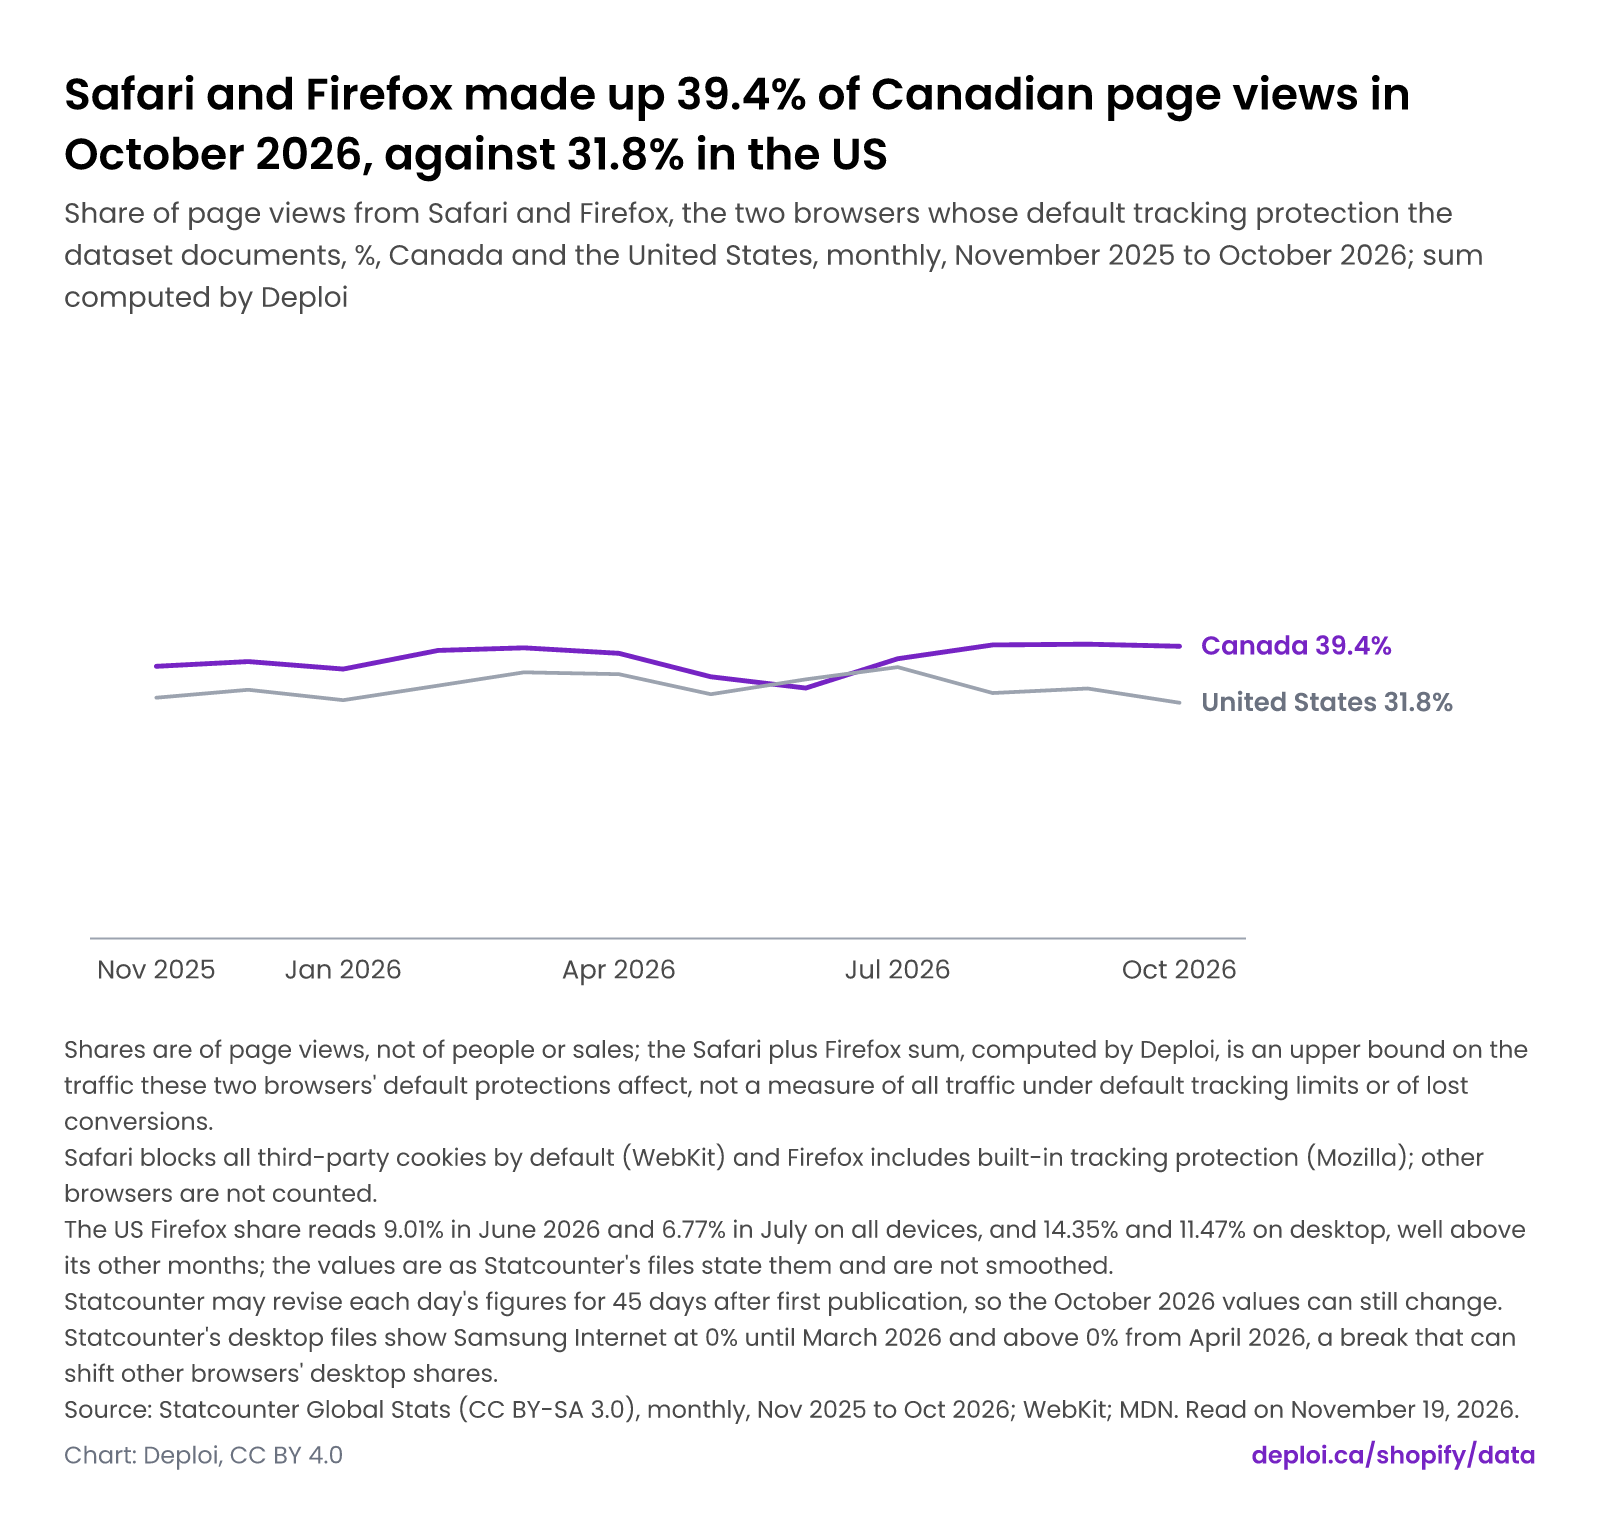
Safari and Firefox made up 39.4% of Canadian page views in October 2026, against 31.8% in the US
Share of page views from Safari and Firefox, the two browsers whose default tracking protection the dataset documents, %, Canada and the United States, monthly, November 2025 to October 2026; sum computed by Deploi
By Martin DejnickiUpdated Data through October 2026
Short answer
Safari and Firefox together made up 39.4% of page views in Canada and 31.8% in the United States in October 2026, according to Statcounter Global Stats, summed by Deploi. On all devices Canada was higher in every month from November 2025 except June 2026, when the US Firefox share read 9.01%. On mobile the October shares were 56.2% in Canada and 46.1% in the US, and on desktop 23.8% and 19.2%.
Safari and Firefox made up 39.4% of Canadian page views in October 2026, against 31.8% in the US
Share of page views from Safari and Firefox, the two browsers whose default tracking protection the dataset documents, %, Canada and the United States, monthly, November 2025 to October 2026; sum computed by Deploi
Mobile: Safari and Firefox share of page views, Canada and the US
Canada, October 2026: Safari and Firefox share of page views by device
- All devices
- 39.4%On all devices, Safari and Firefox made up 39.4% of page views in Canada and 31.8% in the United States in October 2026.
- Mobile
- 56.2%On mobile, Safari and Firefox made up 56.2% of page views in Canada and 46.1% in the United States in October 2026.
- Desktop
- 23.8%On desktop, Safari and Firefox made up 23.8% of page views in Canada and 19.2% in the United States in October 2026.
- Shares are of page views, not of people or sales; the Safari plus Firefox sum, computed by Deploi, is an upper bound on the traffic these two browsers' default protections affect, not a measure of all traffic under default tracking limits or of lost conversions.
- Safari blocks all third-party cookies by default (WebKit) and Firefox includes built-in tracking protection (Mozilla); other browsers are not counted.
- The US Firefox share reads 9.01% in June 2026 and 6.77% in July on all devices, and 14.35% and 11.47% on desktop, well above its other months; the values are as Statcounter's files state them and are not smoothed.
- Statcounter may revise each day's figures for 45 days after first publication, so the October 2026 values can still change.
- Statcounter's desktop files show Samsung Internet at 0% until March 2026 and above 0% from April 2026, a break that can shift other browsers' desktop shares.
Source: Statcounter Global Stats (CC BY-SA 3.0), monthly, Nov 2025 to Oct 2026; WebKit; MDN. Read on .
The data
Each chart on this page is drawn from the numbers below. Units are in the column headers.
Methodology
Reading the chart: Safari and Firefox made up 39.4% of Canadian page views in October 2026, against 31.8% in the US
- Shares are of page views, not of people or sales; the Safari plus Firefox sum, computed by Deploi, is an upper bound on the traffic these two browsers' default protections affect, not a measure of all traffic under default tracking limits or of lost conversions.
- Safari blocks all third-party cookies by default (WebKit) and Firefox includes built-in tracking protection (Mozilla); other browsers are not counted.
- The US Firefox share reads 9.01% in June 2026 and 6.77% in July on all devices, and 14.35% and 11.47% on desktop, well above its other months; the values are as Statcounter's files state them and are not smoothed.
- Statcounter may revise each day's figures for 45 days after first publication, so the October 2026 values can still change.
- Statcounter's desktop files show Samsung Internet at 0% until March 2026 and above 0% from April 2026, a break that can shift other browsers' desktop shares.
Caveats: Share of web traffic from Safari and Firefox, which document built-in tracking protection, Canada and the US, monthly, November 2025 to October 2026
- Shares are of page views as Statcounter measures them, not of people or sales. Only the five browsers in the table are listed, so the shares do not add to 100%.
- The Safari plus Firefox sum is computed by Deploi. It is an upper bound on the traffic these two browsers' default protections affect, not a measure of all traffic under default tracking limits or of lost conversions. The dataset documents no other browser's defaults.
- WebKit documents that Safari's Intelligent Tracking Prevention by default blocks all third-party cookies. MDN says Firefox Desktop and Firefox for Android include built-in tracking protection and that Private Browsing windows block content from domains that track users across sites. The MDN text recorded here does not state what Firefox blocks in standard windows.
- Statcounter's US Firefox share reads 9.01% in June 2026 and 6.77% in July on all devices, and 14.35% and 11.47% on desktop, well above other months. Canada's Firefox share is 5.02% in July 2026 on all devices. The values are as Statcounter's files state them and are not smoothed. The dataset states no cause.
- Statcounter's desktop files show Samsung Internet at 0% until March 2026 and above 0% from April 2026, a break that can shift other browsers' desktop shares.
- Statcounter may revise each day's figures for 45 days after first publication, so the October 2026 values can still change.
- Canada's all devices sum is above the US sum in every month except June 2026. On mobile Canada is below the US in November 2025 and January 2026, and on desktop in June and July 2026.
Deploi's charts and compilation are licensed CC BY 4.0. The underlying facts belong to their sources, which are named on every page. How Deploi Shopify Data works.
Sources
Tier A sources are primary documents: filings, official releases and official price pages. How sources are ranked.
Cite and reuse
Deploi's charts and compilation are licensed CC BY 4.0. The underlying facts belong to their sources, which are named on every page.
APA
Deploi. (2026). Safari and Firefox made up 39.4% of Canadian page views in October 2026, against 31.8% in the US (Version 1) [Chart]. https://deploi.ca/shopify/data/charts/tracking-prevention-share-canada-us Retrieved November 19, 2026.
BibTeX
@misc{deploi_tracking_prevention_share_canada_us_2026,
  author = {{Deploi}},
  title = {Safari and Firefox made up 39.4\% of Canadian page views in October 2026, against 31.8\% in the US},
  year = {2026},
  version = {1},
  url = {https://deploi.ca/shopify/data/charts/tracking-prevention-share-canada-us},
  note = {Accessed 2026-11-19}
}
Embed this chart
Embed code
<iframe src="https://deploi.ca/embed/shopify/data/tracking-prevention-share-canada-us" title="Safari and Firefox made up 39.4% of Canadian page views in October 2026, against 31.8% in the US" loading="lazy" style="width:100%;height:680px;border:0"></iframe>
<p style="font:12px/1.4 Arial,sans-serif;margin:4px 0 0">Source: <a href="https://deploi.ca/shopify/data/charts/tracking-prevention-share-canada-us">Deploi, Safari and Firefox made up 39.4% of Canadian page views in October 2026, against 31.8% in the US</a></p>
Keep the credit line under the embed. It is the license condition.
Changes
- · Share of web traffic from Safari and Firefox, which document built-in tracking protection, Canada and the US, monthly, November 2025 to October 2026
First release. Seventy-two monthly rows (two countries, three device views, twelve months) and two rows of browser documentation. Reworded the scope of the Safari plus Firefox sum to the two browsers whose defaults the dataset documents.