
E-commerce was 17.9% of US retail sales in Q3 2026, the highest seasonally adjusted share in the Census series
E-commerce as a share of total US retail sales, seasonally adjusted, percent, quarterly, Q4 1999 to Q3 2026 (Q3 2026 preliminary)
By Martin DejnickiUpdated Data through September 2026
Short answer
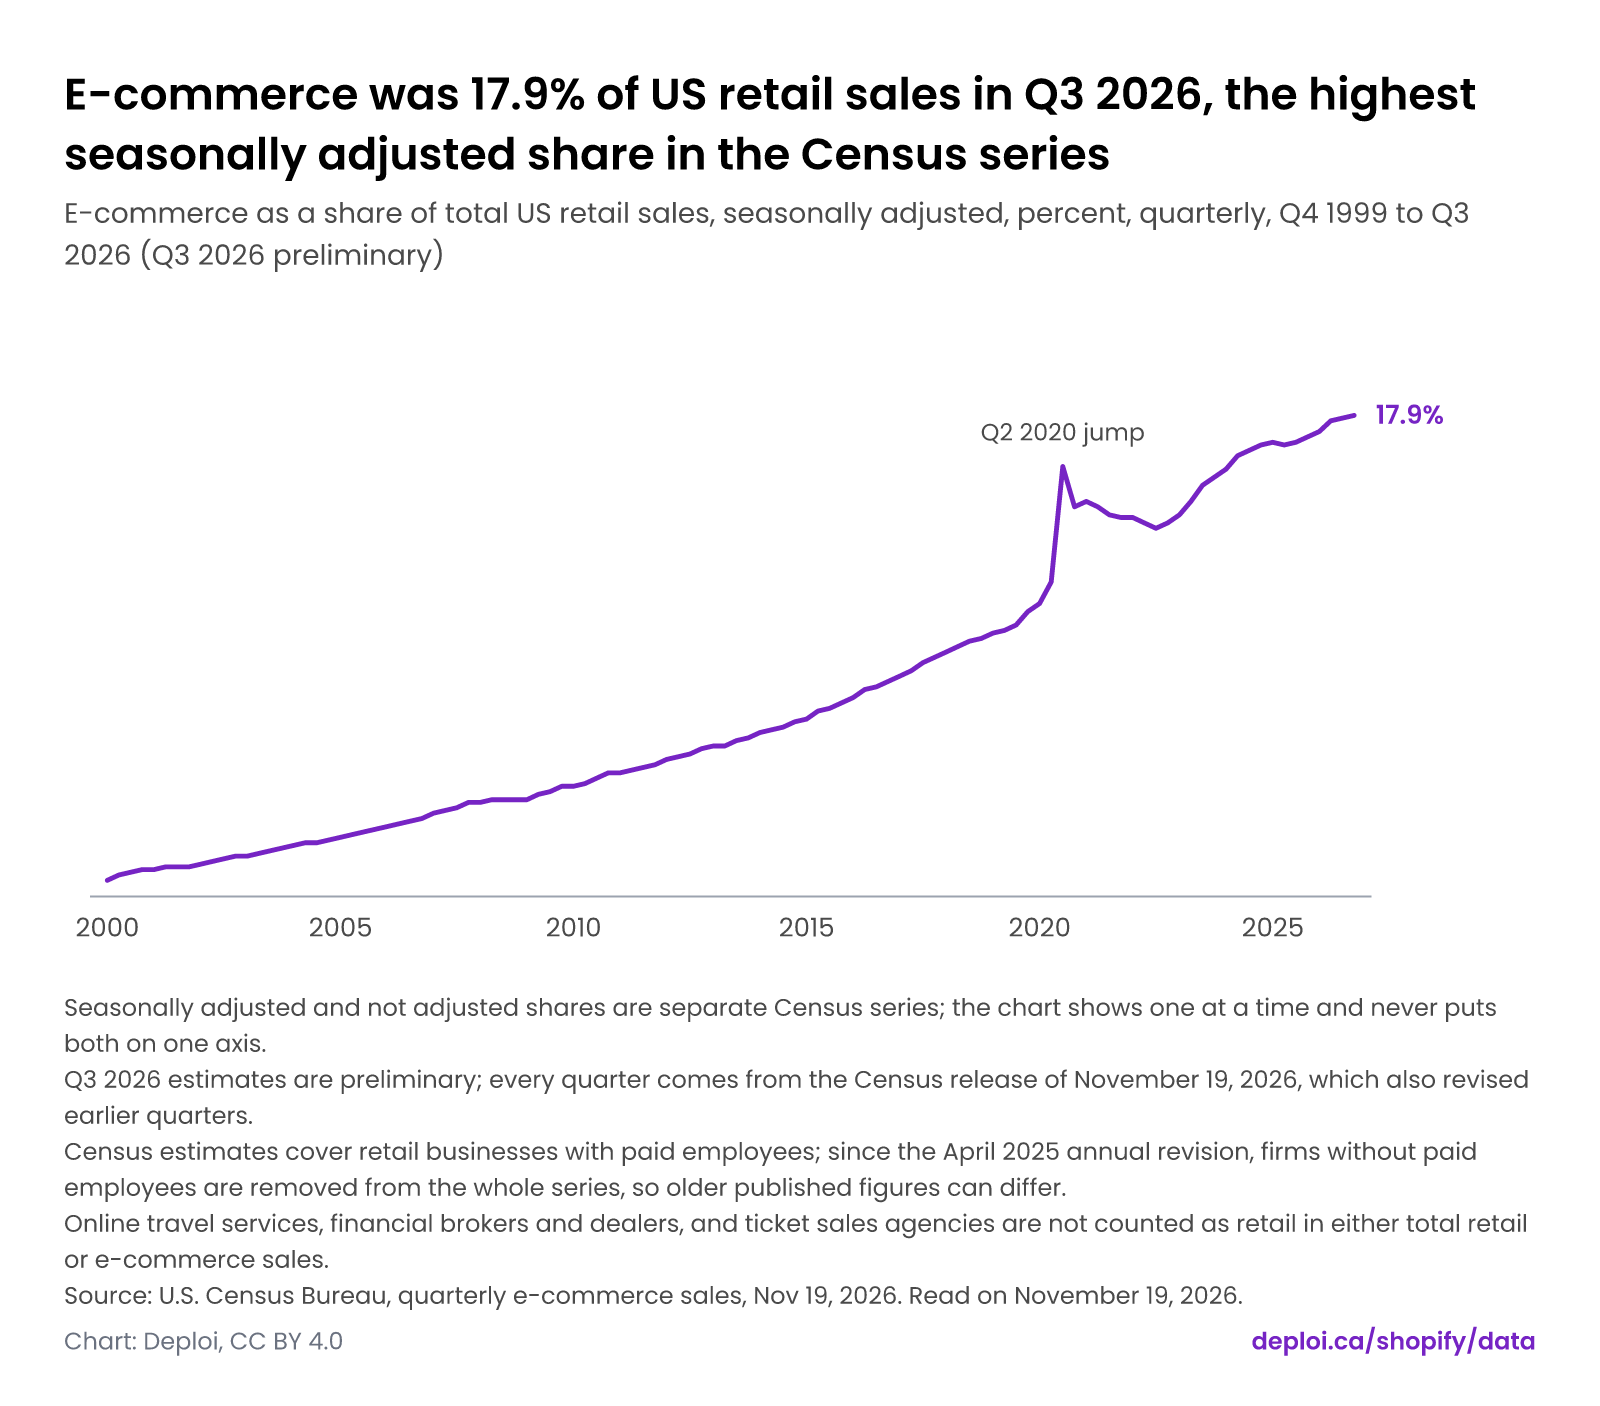
US Census Bureau quarterly estimates show e-commerce rising from 0.6% of seasonally adjusted retail sales in Q4 1999 to 17.9% in Q3 2026, the highest share in the series. The share jumped from 11.7% in Q1 2020 to 16.0% in Q2 2020 and was 17.1% in Q3 2025. Not adjusted, the Q3 2026 share is 17.2%, against 16.5% in Q3 2025. Q3 2026 is preliminary.
E-commerce was 17.9% of US retail sales in Q3 2026, the highest seasonally adjusted share in the Census series
E-commerce as a share of total US retail sales, seasonally adjusted, percent, quarterly, Q4 1999 to Q3 2026 (Q3 2026 preliminary)
Not adjusted e-commerce share of US retail sales, by quarter
E-commerce share of US retail sales in Q3 2026, by series
- Seasonally adjusted
- 17.9%Seasonally adjusted: e-commerce was 17.9% of US retail sales in Q3 2026, against 17.1% in Q3 2025. Use this series to compare one quarter with the next.
- Not adjusted
- 17.2%Not adjusted: e-commerce was 17.2% of US retail sales in Q3 2026 and peaks each fourth quarter, at 18.9% in Q4 2025. Compare a quarter only with the same quarter of another year.
- Seasonally adjusted and not adjusted shares are separate Census series; the chart shows one at a time and never puts both on one axis.
- Q3 2026 estimates are preliminary; every quarter comes from the Census release of November 19, 2026, which also revised earlier quarters.
- Census estimates cover retail businesses with paid employees; since the April 2025 annual revision, firms without paid employees are removed from the whole series, so older published figures can differ.
- Online travel services, financial brokers and dealers, and ticket sales agencies are not counted as retail in either total retail or e-commerce sales.
Source: U.S. Census Bureau, quarterly e-commerce sales, Nov 19, 2026. Read on .
The data
Each chart on this page is drawn from the numbers below. Units are in the column headers.
Methodology
Reading the chart: E-commerce was 17.9% of US retail sales in Q3 2026, the highest seasonally adjusted share in the Census series
- Seasonally adjusted and not adjusted shares are separate Census series; the chart shows one at a time and never puts both on one axis.
- Q3 2026 estimates are preliminary; every quarter comes from the Census release of November 19, 2026, which also revised earlier quarters.
- Census estimates cover retail businesses with paid employees; since the April 2025 annual revision, firms without paid employees are removed from the whole series, so older published figures can differ.
- Online travel services, financial brokers and dealers, and ticket sales agencies are not counted as retail in either total retail or e-commerce sales.
Caveats: E-commerce share of total US retail sales, quarterly, Q4 1999 to Q3 2026
- Q3 2026 estimates are preliminary. Every quarter comes from the Census release of November 19, 2026, which carries a Notice of Revision, so figures in older releases can differ.
- Seasonally adjusted and not adjusted shares are separate Census series. Compare a seasonally adjusted quarter with the next quarter, and a not adjusted quarter only with the same quarter of another year. The two are never combined in one series.
- Census estimates cover retail businesses with paid employees. Since the April 2025 annual revision, firms without paid employees are removed from the whole series.
- Online travel services, financial brokers and dealers, and ticket sales agencies are not counted as retail in total retail or e-commerce sales.
- Shares are as Census states them, to one decimal place. Growth on a year earlier is computed by Deploi from not seasonally adjusted sales and is empty for the first four quarters, with no year-earlier quarter.
- Census does not adjust for price changes, so growth rates measure dollar sales, not quantities.
- Census counts a sale as e-commerce when the buyer places the order, or the price and terms are negotiated, over the internet, a mobile device, an extranet, an EDI network, email or another comparable online system; payment may or may not be made online.
Deploi's charts and compilation are licensed CC BY 4.0. The underlying facts belong to their sources, which are named on every page. How Deploi Shopify Data works.
Sources
Tier A sources are primary documents: filings, official releases and official price pages. How sources are ranked.
- Tier AQuarterly Retail E-Commerce Sales, 3rd Quarter 2026 release page (CB26-183, 2026-11-19; Notice of Revision)
U.S. Census Bureau · HTML · Read on
- Tier AQuarterly Retail E-Commerce Sales, Adjusted Sales Time Series 4Q 1999 to 3Q 2026 (xlsx converted to CSV text, last revised 2026-11-19)
U.S. Census Bureau · TEXT · Read on
- Tier AQuarterly Retail E-Commerce Sales, Not Adjusted Sales Time Series 4Q 1999 to 3Q 2026 (xlsx converted to CSV text, last revised 2026-11-19)
U.S. Census Bureau · TEXT · Read on
Cite and reuse
Deploi's charts and compilation are licensed CC BY 4.0. The underlying facts belong to their sources, which are named on every page.
APA
Deploi. (2026). E-commerce was 17.9% of US retail sales in Q3 2026, the highest seasonally adjusted share in the Census series (Version 1) [Chart]. https://deploi.ca/shopify/data/charts/us-ecommerce-share-quarterly Retrieved November 19, 2026.
BibTeX
@misc{deploi_us_ecommerce_share_quarterly_2026,
  author = {{Deploi}},
  title = {E-commerce was 17.9\% of US retail sales in Q3 2026, the highest seasonally adjusted share in the Census series},
  year = {2026},
  version = {1},
  url = {https://deploi.ca/shopify/data/charts/us-ecommerce-share-quarterly},
  note = {Accessed 2026-11-19}
}
Embed this chart
Embed code
<iframe src="https://deploi.ca/embed/shopify/data/us-ecommerce-share-quarterly" title="E-commerce was 17.9% of US retail sales in Q3 2026, the highest seasonally adjusted share in the Census series" loading="lazy" style="width:100%;height:680px;border:0"></iframe>
<p style="font:12px/1.4 Arial,sans-serif;margin:4px 0 0">Source: <a href="https://deploi.ca/shopify/data/charts/us-ecommerce-share-quarterly">Deploi, E-commerce was 17.9% of US retail sales in Q3 2026, the highest seasonally adjusted share in the Census series</a></p>
Keep the credit line under the embed. It is the license condition.
Changes
- · E-commerce share of total US retail sales, quarterly, Q4 1999 to Q3 2026
First published.