
Average share of retail sales made online by province, Canada, sales years 2021 to 2024
Version 1. 55 rows, 7 columns.
By Martin DejnickiUpdated Data through 2024
Short answer
The average, across retail businesses in each province and in Canada, of the percentage of each business's total sales made online, for sales years 2021 to 2024, with Statistics Canada's quality grade for each value. Sources are Statistics Canada tables 33-10-0518-01, 33-10-0646-01, 33-10-0779-01 and 33-10-0925-01, from the Canadian Survey on Business Conditions, retrieved November 18, 2026.
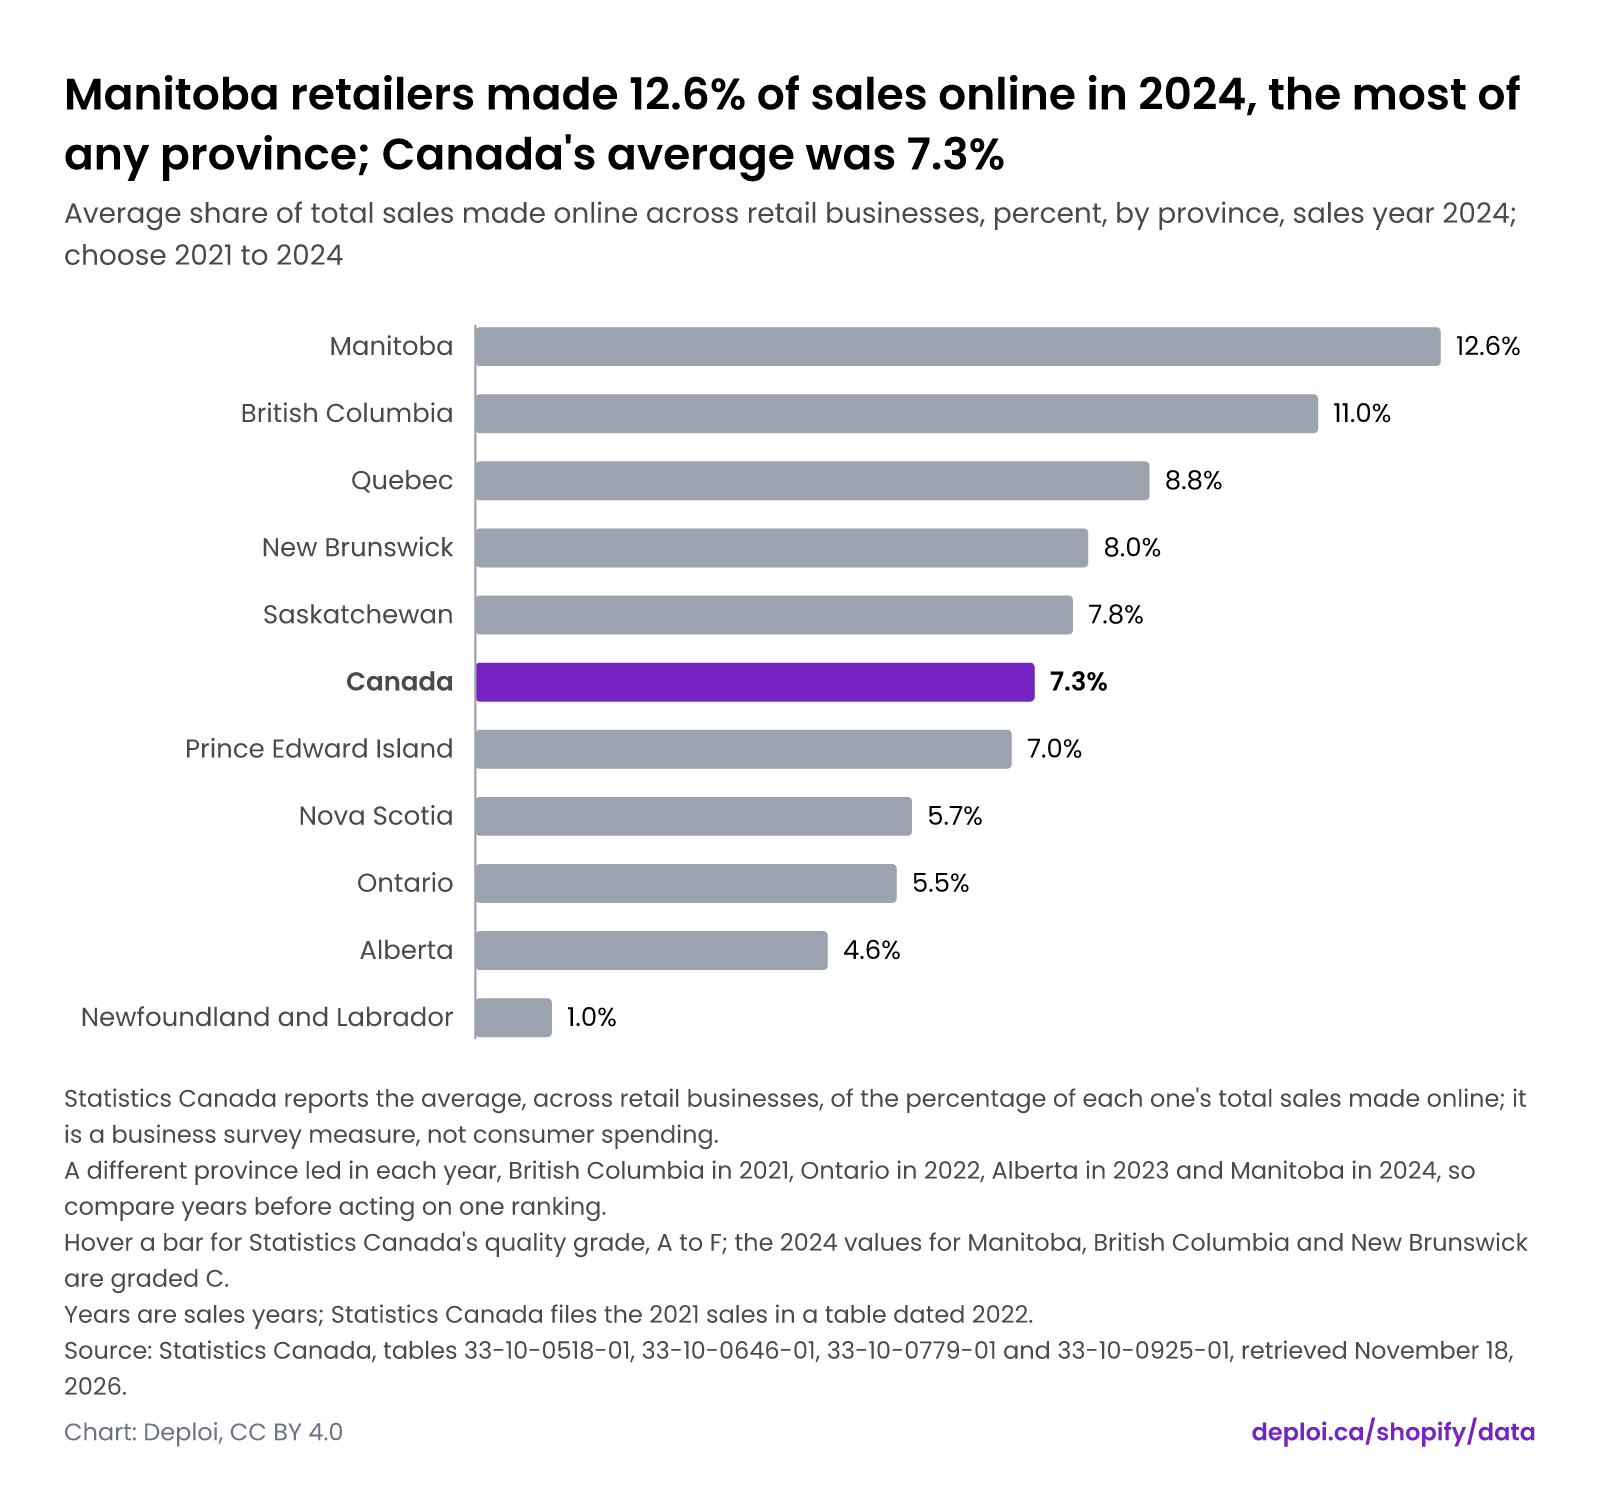
Manitoba retailers made 12.6% of sales online in 2024, the most of any province; Canada's average was 7.3%
Average share of total sales made online across retail businesses, percent, by province, sales year 2024; choose 2021 to 2024
Average share of retail sales made online, by province, 2024
Canada's average share of retail sales made online, by sales year
- 2024
- 7.3%In 2024, Manitoba retailers made 12.6% of their sales online on average, the most of any province, against 7.3% for Canada; Newfoundland and Labrador was lowest at 1.0%.
- 2023
- 5.9%In 2023, Alberta retailers led at 11.0% of sales online on average and Nova Scotia followed at 10.9%, against 5.9% for Canada; Prince Edward Island was lowest at 0.9%.
- 2022
- 7.3%In 2022, Ontario retailers led at 10.7% of sales online on average, against 7.3% for Canada; Saskatchewan was lowest at 3.0%.
- 2021
- 10.9%In 2021, British Columbia retailers led at 14.8% of sales online on average, against 10.9% for Canada; Nova Scotia was lowest at 1.9%.
- Statistics Canada reports the average, across retail businesses, of the percentage of each one's total sales made online; it is a business survey measure, not consumer spending.
- A different province led in each year, British Columbia in 2021, Ontario in 2022, Alberta in 2023 and Manitoba in 2024, so compare years before acting on one ranking.
- Hover a bar for Statistics Canada's quality grade, A to F; the 2024 values for Manitoba, British Columbia and New Brunswick are graded C.
- Years are sales years; Statistics Canada files the 2021 sales in a table dated 2022.
Source: Statistics Canada, tables 33-10-0518-01, 33-10-0646-01, 33-10-0779-01 and 33-10-0925-01, retrieved November 18, 2026. Read on .
About this dataset
The average, across retail businesses in each province and in Canada, of the percentage of each business's total sales made online, for sales years 2021 to 2024, with Statistics Canada's quality grade for each value. Sources are Statistics Canada tables 33-10-0518-01, 33-10-0646-01, 33-10-0779-01 and 33-10-0925-01, from the Canadian Survey on Business Conditions, retrieved November 18, 2026.
- Version
- 1
- Coverage in time
- 2021 to 2024
- Coverage in space
- Canada and its ten provinces
- Last updated
- November 18, 2026
- License
- CC BY 4.0. Deploi's compilation is CC BY 4.0. The underlying figures belong to their publishers and are cited to the sources listed.
Variables
The CSV header uses the column name.
| Column name | Label | Type | Unit | Meaning |
|---|---|---|---|---|
| rowKey | Row | string | text | Stable key of the row: province and sales year. |
| province | Province | string | text | Province, or Canada for the national value. |
| year | Sales year | number | year | Calendar year whose sales the survey asks about. |
| onlineSalesSharePct | Average share of sales made online | number | % | Average, across retail businesses, of the percentage of each business's total sales made online, as Statistics Canada states it. |
| shareSellingOnlinePct | Retailers selling online | string | % | Percentage of retail businesses reporting online sales. Empty: the tables read give the share with no online sales (the 0% band, 71.9% of Canadian retail businesses in 2024) and Deploi has not derived the complement. |
| qualityFlag | Quality grade | string | A to F | Statistics Canada quality indicator for the value, A to F. |
| tableId | Statistics Canada table | string | text | Statistics Canada table number the value comes from. |
The data
Where each value comes from
Every value, the document it was read from, the exact place in it and the date it was read. Computed values show their formula.
Show all 143 traced values
| Row | Field | Value | Source | Where in the source | Read on | Method |
|---|---|---|---|---|---|---|
| Canada|2020 | Sales year | 2020 | Table 33-10-0316-01 Percentage of total sales made online in 2019 and 2020, by business characteristics (full-table CSV; released 2021-03-05) | "2020","Canada","2016A000011124","North American Industry Classification System (NAICS), all industries","Total sales in 2020 made online","Percentage range,… | text | |
| Canada|2021 | Sales year | 2021 | Table 33-10-0518-01 Percentage and average percentage of total sales made online in 2021, second quarter of 2022 (full-table CSV; released 2022-05-30) | "2022","Canada","2021A000011124","North American Industry Classification System (NAICS), all industries","Total sales made online in 2021,… | text | |
| Canada|2021 | Average share of sales made online | 10.9 % | Table 33-10-0518-01 Percentage and average percentage of total sales made online in 2021, second quarter of 2022 (full-table CSV; released 2022-05-30) | …trade [44-45]","Average percentage of total sales made online in 2021","Percent","239","units","0","v1354067327","1.7.13","10.9","A","","","1" | text | |
| Canada|2021 | Quality grade | A | Table 33-10-0518-01 Percentage and average percentage of total sales made online in 2021, second quarter of 2022 (full-table CSV; released 2022-05-30) | "2022","Canada","2021A000011124","Retail trade [44-45]","Average percentage of total sales made online in… | text | |
| Canada|2022 | Sales year | 2022 | Table 33-10-0646-01 Percentage and average percentage of total sales made online in 2022, first quarter of 2023 (full-table CSV; released 2023-02-27) | "2022","Canada","2021A000011124","North American Industry Classification System (NAICS), all… | text | |
| Canada|2022 | Average share of sales made online | 7.3 % | Table 33-10-0646-01 Percentage and average percentage of total sales made online in 2022, first quarter of 2023 (full-table CSV; released 2023-02-27) | "2022","Canada","2021A000011124","Retail trade [44-45]","Average percentage","Percent","239","units","0","v1490192058","1.7.13","7.3","A","","","1" | text | |
| Canada|2022 | Quality grade | A | Table 33-10-0646-01 Percentage and average percentage of total sales made online in 2022, first quarter of 2023 (full-table CSV; released 2023-02-27) | "2022","Canada","2021A000011124","Retail trade [44-45]","Average percentage","Percent","239","units","0","v1490192058","1.7.13","7.3","A","","","1" | text | |
| Canada|2023 | Sales year | 2023 | Table 33-10-0779-01 Percentage and average percentage of total sales made online in 2023 (full-table CSV; released 2024-02-26) | "2023","Canada","2021A000011124","Mining, quarrying, and oil and gas extraction [21]","Percentage of total sales made online in 2023, average… | text | |
| Canada|2023 | Average share of sales made online | 5.9 % | Table 33-10-0779-01 Percentage and average percentage of total sales made online in 2023 (full-table CSV; released 2024-02-26) | …trade [44-45]","Percentage of total sales made online in 2023, average percentage","Percent","239","units","0","v1579703083","1.7.13","5.9","A","","","1" | text | |
| Canada|2023 | Quality grade | A | Table 33-10-0779-01 Percentage and average percentage of total sales made online in 2023 (full-table CSV; released 2024-02-26) | "2023","Canada","2021A000011124","Retail trade [44-45]","Percentage of total sales made online in 2023, average… | text | |
| Canada|2024 | Sales year | 2024 | Table 33-10-0925-01 Percentage and average percentage of total sales made online in 2024 (full-table CSV; released 2025-02-28) | "2024","Canada","2021A000011124","North American Industry Classification System (NAICS), all industries","Percentage of total sales made online in 2024,… | text | |
| Canada|2024 | Average share of sales made online | 7.3 % | Table 33-10-0925-01 Percentage and average percentage of total sales made online in 2024 (full-table CSV; released 2025-02-28) | …trade [44-45]","Percentage of total sales made online in 2024, average percentage","Percent","239","units","0","v1643810267","1.7.13","7.3","A","","","1" | text | |
| Canada|2024 | Quality grade | A | Table 33-10-0925-01 Percentage and average percentage of total sales made online in 2024 (full-table CSV; released 2025-02-28) | "2024","Canada","2021A000011124","Retail trade [44-45]","Percentage of total sales made online in 2024, average… | text | |
| Newfoundland and Labrador|2020 | Sales year | 2020 | Table 33-10-0316-01 Percentage of total sales made online in 2019 and 2020, by business characteristics (full-table CSV; released 2021-03-05) | "2020","Newfoundland and Labrador","2016A000210","North American Industry Classification System (NAICS), all industries","Total sales in 2020 made… | text | |
| Newfoundland and Labrador|2021 | Sales year | 2021 | Table 33-10-0518-01 Percentage and average percentage of total sales made online in 2021, second quarter of 2022 (full-table CSV; released 2022-05-30) | "2022","Newfoundland and Labrador","2021A000210","North American Industry Classification System (NAICS), all industries","Total sales made online in 2021,… | text | |
| Newfoundland and Labrador|2021 | Average share of sales made online | 3.4 % | Table 33-10-0518-01 Percentage and average percentage of total sales made online in 2021, second quarter of 2022 (full-table CSV; released 2022-05-30) | …trade [44-45]","Average percentage of total sales made online in 2021","Percent","239","units","0","v1354072475","2.7.13","3.4","A","","","1" | text | |
| Newfoundland and Labrador|2021 | Quality grade | A | Table 33-10-0518-01 Percentage and average percentage of total sales made online in 2021, second quarter of 2022 (full-table CSV; released 2022-05-30) | "2022","Newfoundland and Labrador","2021A000210","Retail trade [44-45]","Average percentage of total sales made online in… | text | |
| Newfoundland and Labrador|2022 | Sales year | 2022 | Table 33-10-0646-01 Percentage and average percentage of total sales made online in 2022, first quarter of 2023 (full-table CSV; released 2023-02-27) | "2022","Newfoundland and Labrador","2021A000210","North American Industry Classification System (NAICS), all… | text | |
| Newfoundland and Labrador|2022 | Average share of sales made online | 5.4 % | Table 33-10-0646-01 Percentage and average percentage of total sales made online in 2022, first quarter of 2023 (full-table CSV; released 2023-02-27) | …and Labrador","2021A000210","Retail trade [44-45]","Average percentage","Percent","239","units","0","v1490197206","2.7.13","5.4","B","","","1" | text | |
| Newfoundland and Labrador|2022 | Quality grade | B | Table 33-10-0646-01 Percentage and average percentage of total sales made online in 2022, first quarter of 2023 (full-table CSV; released 2023-02-27) | …and Labrador","2021A000210","Retail trade [44-45]","Average percentage","Percent","239","units","0","v1490197206","2.7.13","5.4","B","","","1" | text | |
| Newfoundland and Labrador|2023 | Sales year | 2023 | Table 33-10-0779-01 Percentage and average percentage of total sales made online in 2023 (full-table CSV; released 2024-02-26) | "2023","Newfoundland and Labrador","2021A000210","Urban","Percentage of total sales made online in 2023, average… | text | |
| Newfoundland and Labrador|2023 | Average share of sales made online | 4.5 % | Table 33-10-0779-01 Percentage and average percentage of total sales made online in 2023 (full-table CSV; released 2024-02-26) | …trade [44-45]","Percentage of total sales made online in 2023, average percentage","Percent","239","units","0","v1579708309","2.7.13","4.5","B","","","1" | text | |
| Newfoundland and Labrador|2023 | Quality grade | B | Table 33-10-0779-01 Percentage and average percentage of total sales made online in 2023 (full-table CSV; released 2024-02-26) | …trade [44-45]","Percentage of total sales made online in 2023, average percentage","Percent","239","units","0","v1579708309","2.7.13","4.5","B","","","1" | text | |
| Newfoundland and Labrador|2024 | Sales year | 2024 | Table 33-10-0925-01 Percentage and average percentage of total sales made online in 2024 (full-table CSV; released 2025-02-28) | "2024","Newfoundland and Labrador","2021A000210","North American Industry Classification System (NAICS), all industries","Percentage of total sales made… | text | |
| Newfoundland and Labrador|2024 | Average share of sales made online | 1 % | Table 33-10-0925-01 Percentage and average percentage of total sales made online in 2024 (full-table CSV; released 2025-02-28) | …trade [44-45]","Percentage of total sales made online in 2024, average percentage","Percent","239","units","0","v1643815493","2.7.13","1.0","A","","","1" | text | |
| Newfoundland and Labrador|2024 | Quality grade | A | Table 33-10-0925-01 Percentage and average percentage of total sales made online in 2024 (full-table CSV; released 2025-02-28) | "2024","Newfoundland and Labrador","2021A000210","Retail trade [44-45]","Percentage of total sales made online in 2024, average… | text | |
| Prince Edward Island|2020 | Sales year | 2020 | Table 33-10-0316-01 Percentage of total sales made online in 2019 and 2020, by business characteristics (full-table CSV; released 2021-03-05) | "2020","Prince Edward Island","2016A000211","North American Industry Classification System (NAICS), all industries","Total sales in 2020 made… | text | |
| Prince Edward Island|2021 | Sales year | 2021 | Table 33-10-0518-01 Percentage and average percentage of total sales made online in 2021, second quarter of 2022 (full-table CSV; released 2022-05-30) | "2022","Prince Edward Island","2021A000211","North American Industry Classification System (NAICS), all industries","Total sales made online in 2021,… | text | |
| Prince Edward Island|2021 | Average share of sales made online | 6 % | Table 33-10-0518-01 Percentage and average percentage of total sales made online in 2021, second quarter of 2022 (full-table CSV; released 2022-05-30) | …trade [44-45]","Average percentage of total sales made online in 2021","Percent","239","units","0","v1354073333","3.7.13","6.0","B","","","1" | text | |
| Prince Edward Island|2021 | Quality grade | B | Table 33-10-0518-01 Percentage and average percentage of total sales made online in 2021, second quarter of 2022 (full-table CSV; released 2022-05-30) | …trade [44-45]","Average percentage of total sales made online in 2021","Percent","239","units","0","v1354073333","3.7.13","6.0","B","","","1" | text | |
| Prince Edward Island|2022 | Sales year | 2022 | Table 33-10-0646-01 Percentage and average percentage of total sales made online in 2022, first quarter of 2023 (full-table CSV; released 2023-02-27) | "2022","Prince Edward Island","2021A000211","North American Industry Classification System (NAICS), all… | text | |
| Prince Edward Island|2022 | Average share of sales made online | 4.2 % | Table 33-10-0646-01 Percentage and average percentage of total sales made online in 2022, first quarter of 2023 (full-table CSV; released 2023-02-27) | "2022","Prince Edward Island","2021A000211","Retail trade [44-45]","Average percentage","Percent","239","units","0","v1490198064","3.7.13","4.2","A","","","1" | text | |
| Prince Edward Island|2022 | Quality grade | A | Table 33-10-0646-01 Percentage and average percentage of total sales made online in 2022, first quarter of 2023 (full-table CSV; released 2023-02-27) | "2022","Prince Edward Island","2021A000211","Retail trade [44-45]","Average percentage","Percent","239","units","0","v1490198064","3.7.13","4.2","A","","","1" | text | |
| Prince Edward Island|2023 | Sales year | 2023 | Table 33-10-0779-01 Percentage and average percentage of total sales made online in 2023 (full-table CSV; released 2024-02-26) | "2023","Prince Edward Island","2021A000211","Geography, all geography","Percentage of total sales made online in 2023, average… | text | |
| Prince Edward Island|2023 | Average share of sales made online | 0.9 % | Table 33-10-0779-01 Percentage and average percentage of total sales made online in 2023 (full-table CSV; released 2024-02-26) | …trade [44-45]","Percentage of total sales made online in 2023, average percentage","Percent","239","units","0","v1579709180","3.7.13","0.9","A","","","1" | text | |
| Prince Edward Island|2023 | Quality grade | A | Table 33-10-0779-01 Percentage and average percentage of total sales made online in 2023 (full-table CSV; released 2024-02-26) | "2023","Prince Edward Island","2021A000211","Retail trade [44-45]","Percentage of total sales made online in 2023, average… | text | |
| Prince Edward Island|2024 | Sales year | 2024 | Table 33-10-0925-01 Percentage and average percentage of total sales made online in 2024 (full-table CSV; released 2025-02-28) | "2024","Prince Edward Island","2021A000211","North American Industry Classification System (NAICS), all industries","Percentage of total sales made online in… | text | |
| Prince Edward Island|2024 | Average share of sales made online | 7 % | Table 33-10-0925-01 Percentage and average percentage of total sales made online in 2024 (full-table CSV; released 2025-02-28) | …trade [44-45]","Percentage of total sales made online in 2024, average percentage","Percent","239","units","0","v1643816364","3.7.13","7.0","B","","","1" | text | |
| Prince Edward Island|2024 | Quality grade | B | Table 33-10-0925-01 Percentage and average percentage of total sales made online in 2024 (full-table CSV; released 2025-02-28) | …trade [44-45]","Percentage of total sales made online in 2024, average percentage","Percent","239","units","0","v1643816364","3.7.13","7.0","B","","","1" | text | |
| Nova Scotia|2020 | Sales year | 2020 | Table 33-10-0316-01 Percentage of total sales made online in 2019 and 2020, by business characteristics (full-table CSV; released 2021-03-05) | "2020","Nova Scotia","2016A000212","North American Industry Classification System (NAICS), all industries","Total sales in 2020 made online","Percentage… | text | |
| Nova Scotia|2021 | Sales year | 2021 | Table 33-10-0518-01 Percentage and average percentage of total sales made online in 2021, second quarter of 2022 (full-table CSV; released 2022-05-30) | "2022","Nova Scotia","2021A000212","North American Industry Classification System (NAICS), all industries","Total sales made online in 2021,… | text | |
| Nova Scotia|2021 | Average share of sales made online | 1.9 % | Table 33-10-0518-01 Percentage and average percentage of total sales made online in 2021, second quarter of 2022 (full-table CSV; released 2022-05-30) | …trade [44-45]","Average percentage of total sales made online in 2021","Percent","239","units","0","v1354074191","4.7.13","1.9","A","","","1" | text | |
| Nova Scotia|2021 | Quality grade | A | Table 33-10-0518-01 Percentage and average percentage of total sales made online in 2021, second quarter of 2022 (full-table CSV; released 2022-05-30) | "2022","Nova Scotia","2021A000212","Retail trade [44-45]","Average percentage of total sales made online in… | text | |
| Nova Scotia|2022 | Sales year | 2022 | Table 33-10-0646-01 Percentage and average percentage of total sales made online in 2022, first quarter of 2023 (full-table CSV; released 2023-02-27) | "2022","Nova Scotia","2021A000212","North American Industry Classification System (NAICS), all… | text | |
| Nova Scotia|2022 | Average share of sales made online | 7.9 % | Table 33-10-0646-01 Percentage and average percentage of total sales made online in 2022, first quarter of 2023 (full-table CSV; released 2023-02-27) | "2022","Nova Scotia","2021A000212","Retail trade [44-45]","Average percentage","Percent","239","units","0","v1490198922","4.7.13","7.9","B","","","1" | text | |
| Nova Scotia|2022 | Quality grade | B | Table 33-10-0646-01 Percentage and average percentage of total sales made online in 2022, first quarter of 2023 (full-table CSV; released 2023-02-27) | "2022","Nova Scotia","2021A000212","Retail trade [44-45]","Average percentage","Percent","239","units","0","v1490198922","4.7.13","7.9","B","","","1" | text | |
| Nova Scotia|2023 | Sales year | 2023 | Table 33-10-0779-01 Percentage and average percentage of total sales made online in 2023 (full-table CSV; released 2024-02-26) | "2023","Nova Scotia","2021A000212","Construction [23]","Percentage of total sales made online in 2023, average… | text | |
| Nova Scotia|2023 | Average share of sales made online | 10.9 % | Table 33-10-0779-01 Percentage and average percentage of total sales made online in 2023 (full-table CSV; released 2024-02-26) | …trade [44-45]","Percentage of total sales made online in 2023, average percentage","Percent","239","units","0","v1579710051","4.7.13","10.9","C","","","1" | text | |
| Nova Scotia|2023 | Quality grade | C | Table 33-10-0779-01 Percentage and average percentage of total sales made online in 2023 (full-table CSV; released 2024-02-26) | …trade [44-45]","Percentage of total sales made online in 2023, average percentage","Percent","239","units","0","v1579710051","4.7.13","10.9","C","","","1" | text | |
| Nova Scotia|2024 | Sales year | 2024 | Table 33-10-0925-01 Percentage and average percentage of total sales made online in 2024 (full-table CSV; released 2025-02-28) | "2024","Nova Scotia","2021A000212","North American Industry Classification System (NAICS), all industries","Percentage of total sales made online in 2024,… | text | |
| Nova Scotia|2024 | Average share of sales made online | 5.7 % | Table 33-10-0925-01 Percentage and average percentage of total sales made online in 2024 (full-table CSV; released 2025-02-28) | …trade [44-45]","Percentage of total sales made online in 2024, average percentage","Percent","239","units","0","v1643817235","4.7.13","5.7","B","","","1" | text | |
| Nova Scotia|2024 | Quality grade | B | Table 33-10-0925-01 Percentage and average percentage of total sales made online in 2024 (full-table CSV; released 2025-02-28) | …trade [44-45]","Percentage of total sales made online in 2024, average percentage","Percent","239","units","0","v1643817235","4.7.13","5.7","B","","","1" | text | |
| New Brunswick|2020 | Sales year | 2020 | Table 33-10-0316-01 Percentage of total sales made online in 2019 and 2020, by business characteristics (full-table CSV; released 2021-03-05) | "2020","New Brunswick","2016A000213","North American Industry Classification System (NAICS), all industries","Total sales in 2020 made online","Percentage… | text | |
| New Brunswick|2021 | Sales year | 2021 | Table 33-10-0518-01 Percentage and average percentage of total sales made online in 2021, second quarter of 2022 (full-table CSV; released 2022-05-30) | "2022","New Brunswick","2021A000213","North American Industry Classification System (NAICS), all industries","Total sales made online in 2021,… | text | |
| New Brunswick|2021 | Average share of sales made online | 8.7 % | Table 33-10-0518-01 Percentage and average percentage of total sales made online in 2021, second quarter of 2022 (full-table CSV; released 2022-05-30) | …trade [44-45]","Average percentage of total sales made online in 2021","Percent","239","units","0","v1354075049","5.7.13","8.7","A","","","1" | text | |
| New Brunswick|2021 | Quality grade | A | Table 33-10-0518-01 Percentage and average percentage of total sales made online in 2021, second quarter of 2022 (full-table CSV; released 2022-05-30) | "2022","New Brunswick","2021A000213","Retail trade [44-45]","Average percentage of total sales made online in… | text | |
| New Brunswick|2022 | Sales year | 2022 | Table 33-10-0646-01 Percentage and average percentage of total sales made online in 2022, first quarter of 2023 (full-table CSV; released 2023-02-27) | "2022","New Brunswick","2021A000213","North American Industry Classification System (NAICS), all… | text | |
| New Brunswick|2022 | Average share of sales made online | 4.1 % | Table 33-10-0646-01 Percentage and average percentage of total sales made online in 2022, first quarter of 2023 (full-table CSV; released 2023-02-27) | "2022","New Brunswick","2021A000213","Retail trade [44-45]","Average percentage","Percent","239","units","0","v1490199780","5.7.13","4.1","A","","","1" | text | |
| New Brunswick|2022 | Quality grade | A | Table 33-10-0646-01 Percentage and average percentage of total sales made online in 2022, first quarter of 2023 (full-table CSV; released 2023-02-27) | "2022","New Brunswick","2021A000213","Retail trade [44-45]","Average percentage","Percent","239","units","0","v1490199780","5.7.13","4.1","A","","","1" | text | |
| New Brunswick|2023 | Sales year | 2023 | Table 33-10-0779-01 Percentage and average percentage of total sales made online in 2023 (full-table CSV; released 2024-02-26) | "2023","New Brunswick","2021A000213","Construction [23]","Percentage of total sales made online in 2023, average… | text | |
| New Brunswick|2023 | Average share of sales made online | 4.8 % | Table 33-10-0779-01 Percentage and average percentage of total sales made online in 2023 (full-table CSV; released 2024-02-26) | …trade [44-45]","Percentage of total sales made online in 2023, average percentage","Percent","239","units","0","v1579710922","5.7.13","4.8","B","","","1" | text | |
| New Brunswick|2023 | Quality grade | B | Table 33-10-0779-01 Percentage and average percentage of total sales made online in 2023 (full-table CSV; released 2024-02-26) | "2023","New Brunswick","2021A000213","Retail trade [44-45]","Percentage of total sales made online in 2023, average… | text | |
| New Brunswick|2024 | Sales year | 2024 | Table 33-10-0925-01 Percentage and average percentage of total sales made online in 2024 (full-table CSV; released 2025-02-28) | "2024","New Brunswick","2021A000213","North American Industry Classification System (NAICS), all industries","Percentage of total sales made online in 2024,… | text | |
| New Brunswick|2024 | Average share of sales made online | 8 % | Table 33-10-0925-01 Percentage and average percentage of total sales made online in 2024 (full-table CSV; released 2025-02-28) | …trade [44-45]","Percentage of total sales made online in 2024, average percentage","Percent","239","units","0","v1643818106","5.7.13","8.0","C","","","1" | text | |
| New Brunswick|2024 | Quality grade | C | Table 33-10-0925-01 Percentage and average percentage of total sales made online in 2024 (full-table CSV; released 2025-02-28) | …trade [44-45]","Percentage of total sales made online in 2024, average percentage","Percent","239","units","0","v1643818106","5.7.13","8.0","C","","","1" | text | |
| Quebec|2020 | Sales year | 2020 | Table 33-10-0316-01 Percentage of total sales made online in 2019 and 2020, by business characteristics (full-table CSV; released 2021-03-05) | "2020","Quebec","2016A000224","North American Industry Classification System (NAICS), all industries","Total sales in 2020 made online","Percentage range, 0%… | text | |
| Quebec|2021 | Sales year | 2021 | Table 33-10-0518-01 Percentage and average percentage of total sales made online in 2021, second quarter of 2022 (full-table CSV; released 2022-05-30) | "2022","Quebec","2021A000224","North American Industry Classification System (NAICS), all industries","Total sales made online in 2021,… | text | |
| Quebec|2021 | Average share of sales made online | 8.8 % | Table 33-10-0518-01 Percentage and average percentage of total sales made online in 2021, second quarter of 2022 (full-table CSV; released 2022-05-30) | …trade [44-45]","Average percentage of total sales made online in 2021","Percent","239","units","0","v1354075907","6.7.13","8.8","B","","","1" | text | |
| Quebec|2021 | Quality grade | B | Table 33-10-0518-01 Percentage and average percentage of total sales made online in 2021, second quarter of 2022 (full-table CSV; released 2022-05-30) | …trade [44-45]","Average percentage of total sales made online in 2021","Percent","239","units","0","v1354075907","6.7.13","8.8","B","","","1" | text | |
| Quebec|2022 | Sales year | 2022 | Table 33-10-0646-01 Percentage and average percentage of total sales made online in 2022, first quarter of 2023 (full-table CSV; released 2023-02-27) | "2022","Quebec","2021A000224","North American Industry Classification System (NAICS), all… | text | |
| Quebec|2022 | Average share of sales made online | 5.1 % | Table 33-10-0646-01 Percentage and average percentage of total sales made online in 2022, first quarter of 2023 (full-table CSV; released 2023-02-27) | "2022","Quebec","2021A000224","Retail trade [44-45]","Average percentage","Percent","239","units","0","v1490200638","6.7.13","5.1","A","","","1" | text | |
| Quebec|2022 | Quality grade | A | Table 33-10-0646-01 Percentage and average percentage of total sales made online in 2022, first quarter of 2023 (full-table CSV; released 2023-02-27) | "2022","Quebec","2021A000224","Retail trade [44-45]","Average percentage","Percent","239","units","0","v1490200638","6.7.13","5.1","A","","","1" | text | |
| Quebec|2023 | Sales year | 2023 | Table 33-10-0779-01 Percentage and average percentage of total sales made online in 2023 (full-table CSV; released 2024-02-26) | "2023","Quebec","2021A000224","Retail trade [44-45]","Percentage of total sales made online in 2023, average… | text | |
| Quebec|2023 | Average share of sales made online | 7 % | Table 33-10-0779-01 Percentage and average percentage of total sales made online in 2023 (full-table CSV; released 2024-02-26) | …trade [44-45]","Percentage of total sales made online in 2023, average percentage","Percent","239","units","0","v1579711793","6.7.13","7.0","A","","","1" | text | |
| Quebec|2023 | Quality grade | A | Table 33-10-0779-01 Percentage and average percentage of total sales made online in 2023 (full-table CSV; released 2024-02-26) | "2023","Quebec","2021A000224","Retail trade [44-45]","Percentage of total sales made online in 2023, average… | text | |
| Quebec|2024 | Sales year | 2024 | Table 33-10-0925-01 Percentage and average percentage of total sales made online in 2024 (full-table CSV; released 2025-02-28) | "2024","Quebec","2021A000224","North American Industry Classification System (NAICS), all industries","Percentage of total sales made online in 2024,… | text | |
| Quebec|2024 | Average share of sales made online | 8.8 % | Table 33-10-0925-01 Percentage and average percentage of total sales made online in 2024 (full-table CSV; released 2025-02-28) | …trade [44-45]","Percentage of total sales made online in 2024, average percentage","Percent","239","units","0","v1643818977","6.7.13","8.8","B","","","1" | text | |
| Quebec|2024 | Quality grade | B | Table 33-10-0925-01 Percentage and average percentage of total sales made online in 2024 (full-table CSV; released 2025-02-28) | …trade [44-45]","Percentage of total sales made online in 2024, average percentage","Percent","239","units","0","v1643818977","6.7.13","8.8","B","","","1" | text | |
| Ontario|2020 | Sales year | 2020 | Table 33-10-0316-01 Percentage of total sales made online in 2019 and 2020, by business characteristics (full-table CSV; released 2021-03-05) | "2020","Ontario","2016A000235","North American Industry Classification System (NAICS), all industries","Total sales in 2020 made online","Percentage range,… | text | |
| Ontario|2021 | Sales year | 2021 | Table 33-10-0518-01 Percentage and average percentage of total sales made online in 2021, second quarter of 2022 (full-table CSV; released 2022-05-30) | "2022","Ontario","2021A000235","North American Industry Classification System (NAICS), all industries","Total sales made online in 2021,… | text | |
| Ontario|2021 | Average share of sales made online | 12.6 % | Table 33-10-0518-01 Percentage and average percentage of total sales made online in 2021, second quarter of 2022 (full-table CSV; released 2022-05-30) | …trade [44-45]","Average percentage of total sales made online in 2021","Percent","239","units","0","v1354076765","7.7.13","12.6","B","","","1" | text | |
| Ontario|2021 | Quality grade | B | Table 33-10-0518-01 Percentage and average percentage of total sales made online in 2021, second quarter of 2022 (full-table CSV; released 2022-05-30) | …trade [44-45]","Average percentage of total sales made online in 2021","Percent","239","units","0","v1354076765","7.7.13","12.6","B","","","1" | text | |
| Ontario|2022 | Sales year | 2022 | Table 33-10-0646-01 Percentage and average percentage of total sales made online in 2022, first quarter of 2023 (full-table CSV; released 2023-02-27) | "2022","Ontario","2021A000235","North American Industry Classification System (NAICS), all… | text | |
| Ontario|2022 | Average share of sales made online | 10.7 % | Table 33-10-0646-01 Percentage and average percentage of total sales made online in 2022, first quarter of 2023 (full-table CSV; released 2023-02-27) | "2022","Ontario","2021A000235","Retail trade [44-45]","Average percentage","Percent","239","units","0","v1490201496","7.7.13","10.7","C","","","1" | text | |
| Ontario|2022 | Quality grade | C | Table 33-10-0646-01 Percentage and average percentage of total sales made online in 2022, first quarter of 2023 (full-table CSV; released 2023-02-27) | "2022","Ontario","2021A000235","Retail trade [44-45]","Average percentage","Percent","239","units","0","v1490201496","7.7.13","10.7","C","","","1" | text | |
| Ontario|2023 | Sales year | 2023 | Table 33-10-0779-01 Percentage and average percentage of total sales made online in 2023 (full-table CSV; released 2024-02-26) | "2023","Ontario","2021A000235","Retail trade [44-45]","Percentage of total sales made online in 2023, average… | text | |
| Ontario|2023 | Average share of sales made online | 3 % | Table 33-10-0779-01 Percentage and average percentage of total sales made online in 2023 (full-table CSV; released 2024-02-26) | …trade [44-45]","Percentage of total sales made online in 2023, average percentage","Percent","239","units","0","v1579712664","7.7.13","3.0","A","","","1" | text | |
| Ontario|2023 | Quality grade | A | Table 33-10-0779-01 Percentage and average percentage of total sales made online in 2023 (full-table CSV; released 2024-02-26) | "2023","Ontario","2021A000235","Retail trade [44-45]","Percentage of total sales made online in 2023, average… | text | |
| Ontario|2024 | Sales year | 2024 | Table 33-10-0925-01 Percentage and average percentage of total sales made online in 2024 (full-table CSV; released 2025-02-28) | "2024","Ontario","2021A000235","North American Industry Classification System (NAICS), all industries","Percentage of total sales made online in 2024,… | text | |
| Ontario|2024 | Average share of sales made online | 5.5 % | Table 33-10-0925-01 Percentage and average percentage of total sales made online in 2024 (full-table CSV; released 2025-02-28) | …trade [44-45]","Percentage of total sales made online in 2024, average percentage","Percent","239","units","0","v1643819848","7.7.13","5.5","A","","","1" | text | |
| Ontario|2024 | Quality grade | A | Table 33-10-0925-01 Percentage and average percentage of total sales made online in 2024 (full-table CSV; released 2025-02-28) | "2024","Ontario","2021A000235","Retail trade [44-45]","Percentage of total sales made online in 2024, average… | text | |
| Manitoba|2020 | Sales year | 2020 | Table 33-10-0316-01 Percentage of total sales made online in 2019 and 2020, by business characteristics (full-table CSV; released 2021-03-05) | "2020","Manitoba","2016A000246","North American Industry Classification System (NAICS), all industries","Total sales in 2020 made online","Percentage range,… | text | |
| Manitoba|2021 | Sales year | 2021 | Table 33-10-0518-01 Percentage and average percentage of total sales made online in 2021, second quarter of 2022 (full-table CSV; released 2022-05-30) | "2022","Manitoba","2021A000246","North American Industry Classification System (NAICS), all industries","Total sales made online in 2021,… | text | |
| Manitoba|2021 | Average share of sales made online | 11 % | Table 33-10-0518-01 Percentage and average percentage of total sales made online in 2021, second quarter of 2022 (full-table CSV; released 2022-05-30) | …trade [44-45]","Average percentage of total sales made online in 2021","Percent","239","units","0","v1354077623","8.7.13","11.0","B","","","1" | text | |
| Manitoba|2021 | Quality grade | B | Table 33-10-0518-01 Percentage and average percentage of total sales made online in 2021, second quarter of 2022 (full-table CSV; released 2022-05-30) | …trade [44-45]","Average percentage of total sales made online in 2021","Percent","239","units","0","v1354077623","8.7.13","11.0","B","","","1" | text | |
| Manitoba|2022 | Sales year | 2022 | Table 33-10-0646-01 Percentage and average percentage of total sales made online in 2022, first quarter of 2023 (full-table CSV; released 2023-02-27) | "2022","Manitoba","2021A000246","North American Industry Classification System (NAICS), all… | text | |
| Manitoba|2022 | Average share of sales made online | 4.6 % | Table 33-10-0646-01 Percentage and average percentage of total sales made online in 2022, first quarter of 2023 (full-table CSV; released 2023-02-27) | "2022","Manitoba","2021A000246","Retail trade [44-45]","Average percentage","Percent","239","units","0","v1490202354","8.7.13","4.6","A","","","1" | text | |
| Manitoba|2022 | Quality grade | A | Table 33-10-0646-01 Percentage and average percentage of total sales made online in 2022, first quarter of 2023 (full-table CSV; released 2023-02-27) | "2022","Manitoba","2021A000246","Retail trade [44-45]","Average percentage","Percent","239","units","0","v1490202354","8.7.13","4.6","A","","","1" | text | |
| Manitoba|2023 | Sales year | 2023 | Table 33-10-0779-01 Percentage and average percentage of total sales made online in 2023 (full-table CSV; released 2024-02-26) | "2023","Manitoba","2021A000246","Mining, quarrying, and oil and gas extraction [21]","Percentage of total sales made online in 2023, average… | text | |
| Manitoba|2023 | Average share of sales made online | 2.4 % | Table 33-10-0779-01 Percentage and average percentage of total sales made online in 2023 (full-table CSV; released 2024-02-26) | …trade [44-45]","Percentage of total sales made online in 2023, average percentage","Percent","239","units","0","v1579713535","8.7.13","2.4","A","","","1" | text | |
| Manitoba|2023 | Quality grade | A | Table 33-10-0779-01 Percentage and average percentage of total sales made online in 2023 (full-table CSV; released 2024-02-26) | "2023","Manitoba","2021A000246","Retail trade [44-45]","Percentage of total sales made online in 2023, average… | text | |
| Manitoba|2024 | Sales year | 2024 | Table 33-10-0925-01 Percentage and average percentage of total sales made online in 2024 (full-table CSV; released 2025-02-28) | "2024","Manitoba","2021A000246","North American Industry Classification System (NAICS), all industries","Percentage of total sales made online in 2024,… | text | |
| Manitoba|2024 | Average share of sales made online | 12.6 % | Table 33-10-0925-01 Percentage and average percentage of total sales made online in 2024 (full-table CSV; released 2025-02-28) | …trade [44-45]","Percentage of total sales made online in 2024, average percentage","Percent","239","units","0","v1643820719","8.7.13","12.6","C","","","1" | text | |
| Manitoba|2024 | Quality grade | C | Table 33-10-0925-01 Percentage and average percentage of total sales made online in 2024 (full-table CSV; released 2025-02-28) | …trade [44-45]","Percentage of total sales made online in 2024, average percentage","Percent","239","units","0","v1643820719","8.7.13","12.6","C","","","1" | text | |
| Saskatchewan|2020 | Sales year | 2020 | Table 33-10-0316-01 Percentage of total sales made online in 2019 and 2020, by business characteristics (full-table CSV; released 2021-03-05) | "2020","Saskatchewan","2016A000247","North American Industry Classification System (NAICS), all industries","Total sales in 2020 made online","Percentage… | text | |
| Saskatchewan|2021 | Sales year | 2021 | Table 33-10-0518-01 Percentage and average percentage of total sales made online in 2021, second quarter of 2022 (full-table CSV; released 2022-05-30) | "2022","Saskatchewan","2021A000247","North American Industry Classification System (NAICS), all industries","Total sales made online in 2021,… | text | |
| Saskatchewan|2021 | Average share of sales made online | 2.5 % | Table 33-10-0518-01 Percentage and average percentage of total sales made online in 2021, second quarter of 2022 (full-table CSV; released 2022-05-30) | …trade [44-45]","Average percentage of total sales made online in 2021","Percent","239","units","0","v1354078481","9.7.13","2.5","A","","","1" | text | |
| Saskatchewan|2021 | Quality grade | A | Table 33-10-0518-01 Percentage and average percentage of total sales made online in 2021, second quarter of 2022 (full-table CSV; released 2022-05-30) | "2022","Saskatchewan","2021A000247","Retail trade [44-45]","Average percentage of total sales made online in… | text | |
| Saskatchewan|2022 | Sales year | 2022 | Table 33-10-0646-01 Percentage and average percentage of total sales made online in 2022, first quarter of 2023 (full-table CSV; released 2023-02-27) | "2022","Saskatchewan","2021A000247","North American Industry Classification System (NAICS), all… | text | |
| Saskatchewan|2022 | Average share of sales made online | 3 % | Table 33-10-0646-01 Percentage and average percentage of total sales made online in 2022, first quarter of 2023 (full-table CSV; released 2023-02-27) | "2022","Saskatchewan","2021A000247","Retail trade [44-45]","Average percentage","Percent","239","units","0","v1490203212","9.7.13","3.0","A","","","1" | text | |
| Saskatchewan|2022 | Quality grade | A | Table 33-10-0646-01 Percentage and average percentage of total sales made online in 2022, first quarter of 2023 (full-table CSV; released 2023-02-27) | "2022","Saskatchewan","2021A000247","Retail trade [44-45]","Average percentage","Percent","239","units","0","v1490203212","9.7.13","3.0","A","","","1" | text | |
| Saskatchewan|2023 | Sales year | 2023 | Table 33-10-0779-01 Percentage and average percentage of total sales made online in 2023 (full-table CSV; released 2024-02-26) | "2023","Saskatchewan","2021A000247","Construction [23]","Percentage of total sales made online in 2023, average… | text | |
| Saskatchewan|2023 | Average share of sales made online | 2.7 % | Table 33-10-0779-01 Percentage and average percentage of total sales made online in 2023 (full-table CSV; released 2024-02-26) | …trade [44-45]","Percentage of total sales made online in 2023, average percentage","Percent","239","units","0","v1579714406","9.7.13","2.7","A","","","1" | text | |
| Saskatchewan|2023 | Quality grade | A | Table 33-10-0779-01 Percentage and average percentage of total sales made online in 2023 (full-table CSV; released 2024-02-26) | "2023","Saskatchewan","2021A000247","Retail trade [44-45]","Percentage of total sales made online in 2023, average… | text | |
| Saskatchewan|2024 | Sales year | 2024 | Table 33-10-0925-01 Percentage and average percentage of total sales made online in 2024 (full-table CSV; released 2025-02-28) | "2024","Saskatchewan","2021A000247","North American Industry Classification System (NAICS), all industries","Percentage of total sales made online in 2024,… | text | |
| Saskatchewan|2024 | Average share of sales made online | 7.8 % | Table 33-10-0925-01 Percentage and average percentage of total sales made online in 2024 (full-table CSV; released 2025-02-28) | …trade [44-45]","Percentage of total sales made online in 2024, average percentage","Percent","239","units","0","v1643821590","9.7.13","7.8","B","","","1" | text | |
| Saskatchewan|2024 | Quality grade | B | Table 33-10-0925-01 Percentage and average percentage of total sales made online in 2024 (full-table CSV; released 2025-02-28) | …trade [44-45]","Percentage of total sales made online in 2024, average percentage","Percent","239","units","0","v1643821590","9.7.13","7.8","B","","","1" | text | |
| Alberta|2020 | Sales year | 2020 | Table 33-10-0316-01 Percentage of total sales made online in 2019 and 2020, by business characteristics (full-table CSV; released 2021-03-05) | "2020","Alberta","2016A000248","North American Industry Classification System (NAICS), all industries","Total sales in 2020 made online","Percentage range,… | text | |
| Alberta|2021 | Sales year | 2021 | Table 33-10-0518-01 Percentage and average percentage of total sales made online in 2021, second quarter of 2022 (full-table CSV; released 2022-05-30) | "2022","Alberta","2021A000248","North American Industry Classification System (NAICS), all industries","Total sales made online in 2021,… | text | |
| Alberta|2021 | Average share of sales made online | 12.2 % | Table 33-10-0518-01 Percentage and average percentage of total sales made online in 2021, second quarter of 2022 (full-table CSV; released 2022-05-30) | …trade [44-45]","Average percentage of total sales made online in 2021","Percent","239","units","0","v1354068185","10.7.13","12.2","B","","","1" | text | |
| Alberta|2021 | Quality grade | B | Table 33-10-0518-01 Percentage and average percentage of total sales made online in 2021, second quarter of 2022 (full-table CSV; released 2022-05-30) | …trade [44-45]","Average percentage of total sales made online in 2021","Percent","239","units","0","v1354068185","10.7.13","12.2","B","","","1" | text | |
| Alberta|2022 | Sales year | 2022 | Table 33-10-0646-01 Percentage and average percentage of total sales made online in 2022, first quarter of 2023 (full-table CSV; released 2023-02-27) | "2022","Alberta","2021A000248","North American Industry Classification System (NAICS), all… | text | |
| Alberta|2022 | Average share of sales made online | 6.3 % | Table 33-10-0646-01 Percentage and average percentage of total sales made online in 2022, first quarter of 2023 (full-table CSV; released 2023-02-27) | "2022","Alberta","2021A000248","Retail trade [44-45]","Average percentage","Percent","239","units","0","v1490192916","10.7.13","6.3","B","","","1" | text | |
| Alberta|2022 | Quality grade | B | Table 33-10-0646-01 Percentage and average percentage of total sales made online in 2022, first quarter of 2023 (full-table CSV; released 2023-02-27) | "2022","Alberta","2021A000248","Retail trade [44-45]","Average percentage","Percent","239","units","0","v1490192916","10.7.13","6.3","B","","","1" | text | |
| Alberta|2023 | Sales year | 2023 | Table 33-10-0779-01 Percentage and average percentage of total sales made online in 2023 (full-table CSV; released 2024-02-26) | "2023","Alberta","2021A000248","Retail trade [44-45]","Percentage of total sales made online in 2023, average… | text | |
| Alberta|2023 | Average share of sales made online | 11 % | Table 33-10-0779-01 Percentage and average percentage of total sales made online in 2023 (full-table CSV; released 2024-02-26) | …trade [44-45]","Percentage of total sales made online in 2023, average percentage","Percent","239","units","0","v1579703954","10.7.13","11.0","B","","","1" | text | |
| Alberta|2023 | Quality grade | B | Table 33-10-0779-01 Percentage and average percentage of total sales made online in 2023 (full-table CSV; released 2024-02-26) | …trade [44-45]","Percentage of total sales made online in 2023, average percentage","Percent","239","units","0","v1579703954","10.7.13","11.0","B","","","1" | text | |
| Alberta|2024 | Sales year | 2024 | Table 33-10-0925-01 Percentage and average percentage of total sales made online in 2024 (full-table CSV; released 2025-02-28) | "2024","Alberta","2021A000248","North American Industry Classification System (NAICS), all industries","Percentage of total sales made online in 2024,… | text | |
| Alberta|2024 | Average share of sales made online | 4.6 % | Table 33-10-0925-01 Percentage and average percentage of total sales made online in 2024 (full-table CSV; released 2025-02-28) | …trade [44-45]","Percentage of total sales made online in 2024, average percentage","Percent","239","units","0","v1643811138","10.7.13","4.6","A","","","1" | text | |
| Alberta|2024 | Quality grade | A | Table 33-10-0925-01 Percentage and average percentage of total sales made online in 2024 (full-table CSV; released 2025-02-28) | "2024","Alberta","2021A000248","Retail trade [44-45]","Percentage of total sales made online in 2024, average… | text | |
| British Columbia|2020 | Sales year | 2020 | Table 33-10-0316-01 Percentage of total sales made online in 2019 and 2020, by business characteristics (full-table CSV; released 2021-03-05) | "2020","British Columbia","2016A000259","North American Industry Classification System (NAICS), all industries","Total sales in 2020 made online","Percentage… | text | |
| British Columbia|2021 | Sales year | 2021 | Table 33-10-0518-01 Percentage and average percentage of total sales made online in 2021, second quarter of 2022 (full-table CSV; released 2022-05-30) | "2022","British Columbia","2021A000259","North American Industry Classification System (NAICS), all industries","Total sales made online in 2021,… | text | |
| British Columbia|2021 | Average share of sales made online | 14.8 % | Table 33-10-0518-01 Percentage and average percentage of total sales made online in 2021, second quarter of 2022 (full-table CSV; released 2022-05-30) | …trade [44-45]","Average percentage of total sales made online in 2021","Percent","239","units","0","v1354069043","11.7.13","14.8","C","","","1" | text | |
| British Columbia|2021 | Quality grade | C | Table 33-10-0518-01 Percentage and average percentage of total sales made online in 2021, second quarter of 2022 (full-table CSV; released 2022-05-30) | "2022","British Columbia","2021A000259","Retail trade [44-45]","Average percentage of total sales made online in… | text | |
| British Columbia|2022 | Sales year | 2022 | Table 33-10-0646-01 Percentage and average percentage of total sales made online in 2022, first quarter of 2023 (full-table CSV; released 2023-02-27) | "2022","British Columbia","2021A000259","North American Industry Classification System (NAICS), all… | text | |
| British Columbia|2022 | Average share of sales made online | 6.1 % | Table 33-10-0646-01 Percentage and average percentage of total sales made online in 2022, first quarter of 2023 (full-table CSV; released 2023-02-27) | "2022","British Columbia","2021A000259","Retail trade [44-45]","Average percentage","Percent","239","units","0","v1490193774","11.7.13","6.1","B","","","1" | text | |
| British Columbia|2022 | Quality grade | B | Table 33-10-0646-01 Percentage and average percentage of total sales made online in 2022, first quarter of 2023 (full-table CSV; released 2023-02-27) | "2022","British Columbia","2021A000259","Retail trade [44-45]","Average percentage","Percent","239","units","0","v1490193774","11.7.13","6.1","B","","","1" | text | |
| British Columbia|2023 | Sales year | 2023 | Table 33-10-0779-01 Percentage and average percentage of total sales made online in 2023 (full-table CSV; released 2024-02-26) | "2023","British Columbia","2021A000259","Construction [23]","Percentage of total sales made online in 2023, average… | text | |
| British Columbia|2023 | Average share of sales made online | 8 % | Table 33-10-0779-01 Percentage and average percentage of total sales made online in 2023 (full-table CSV; released 2024-02-26) | …trade [44-45]","Percentage of total sales made online in 2023, average percentage","Percent","239","units","0","v1579704825","11.7.13","8.0","A","","","1" | text | |
| British Columbia|2023 | Quality grade | A | Table 33-10-0779-01 Percentage and average percentage of total sales made online in 2023 (full-table CSV; released 2024-02-26) | "2023","British Columbia","2021A000259","Retail trade [44-45]","Percentage of total sales made online in 2023, average… | text | |
| British Columbia|2024 | Sales year | 2024 | Table 33-10-0925-01 Percentage and average percentage of total sales made online in 2024 (full-table CSV; released 2025-02-28) | "2024","British Columbia","2021A000259","North American Industry Classification System (NAICS), all industries","Percentage of total sales made online in… | text | |
| British Columbia|2024 | Average share of sales made online | 11 % | Table 33-10-0925-01 Percentage and average percentage of total sales made online in 2024 (full-table CSV; released 2025-02-28) | …trade [44-45]","Percentage of total sales made online in 2024, average percentage","Percent","239","units","0","v1643812009","11.7.13","11.0","C","","","1" | text | |
| British Columbia|2024 | Quality grade | C | Table 33-10-0925-01 Percentage and average percentage of total sales made online in 2024 (full-table CSV; released 2025-02-28) | "2024","British Columbia","2021A000259","Retail trade [44-45]","Percentage of total sales made online in 2024, average… | text |
Methodology
Caveats: Average share of retail sales made online by province, Canada, sales years 2021 to 2024
- This is a business survey measure: the average across retail businesses of each one's share of sales made online. It is not consumer spending and not the share of retail dollars sold online.
- Statistics Canada grades each value from A to F. The 2024 values for Manitoba, British Columbia and New Brunswick are graded C, and several other values carry grade B or C. Provincial values swing by several points between years, so one year's ranking is a weak basis for a decision.
- Years are sales years. Statistics Canada files the 2021 sales in a table dated 2022, and the dataset records the sales year.
- The tables read give the share of retailers with no online sales (the 0% band): 71.9% of Canadian retail businesses in 2024 (Retail trade [44-45], table 33-10-0925-01). Deploi has not derived the complement, so the share of retailers that sell online is empty here. The 2020 rows are listed without values.
Deploi's charts and compilation are licensed CC BY 4.0. The underlying facts belong to their sources, which are named on every page. How Deploi Shopify Data works.
Sources
Tier A sources are primary documents: filings, official releases and official price pages. How sources are ranked.
- Tier A
- Tier A
- Tier A
- Tier ATable 33-10-0779-01 Percentage and average percentage of total sales made online in 2023 (full-table CSV; released 2024-02-26)
Statistics Canada · TEXT · Read on
- Tier ATable 33-10-0925-01 Percentage and average percentage of total sales made online in 2024 (full-table CSV; released 2025-02-28)
Statistics Canada · TEXT · Read on
Cite and reuse
Deploi's charts and compilation are licensed CC BY 4.0. The underlying facts belong to their sources, which are named on every page.
APA
Deploi. (2026). Average share of retail sales made online by province, Canada, sales years 2021 to 2024 (Version 1) [Data set]. https://deploi.ca/shopify/data/datasets/canada-province-online-sales Retrieved November 18, 2026.
BibTeX
@misc{deploi_canada_province_online_sales_2026,
  author = {{Deploi}},
  title = {Average share of retail sales made online by province, Canada, sales years 2021 to 2024},
  year = {2026},
  version = {1},
  url = {https://deploi.ca/shopify/data/datasets/canada-province-online-sales},
  note = {Accessed 2026-11-18}
}
Downloads
- Data: Average share of retail sales made online by province, Canada, sales years 2021 to 2024 CSV
Changes
- · Average share of retail sales made online by province, Canada, sales years 2021 to 2024
First published.