
What has Shopify disclosed about AI and agentic commerce usage, quarter by quarter?
Shopify's investor presentations carried 9 AI usage metrics in Q2 2026, up from 1 in Q3 2025, counted by Deploi. Updated October 18, 2026.
By Martin DejnickiUpdated
Short answer
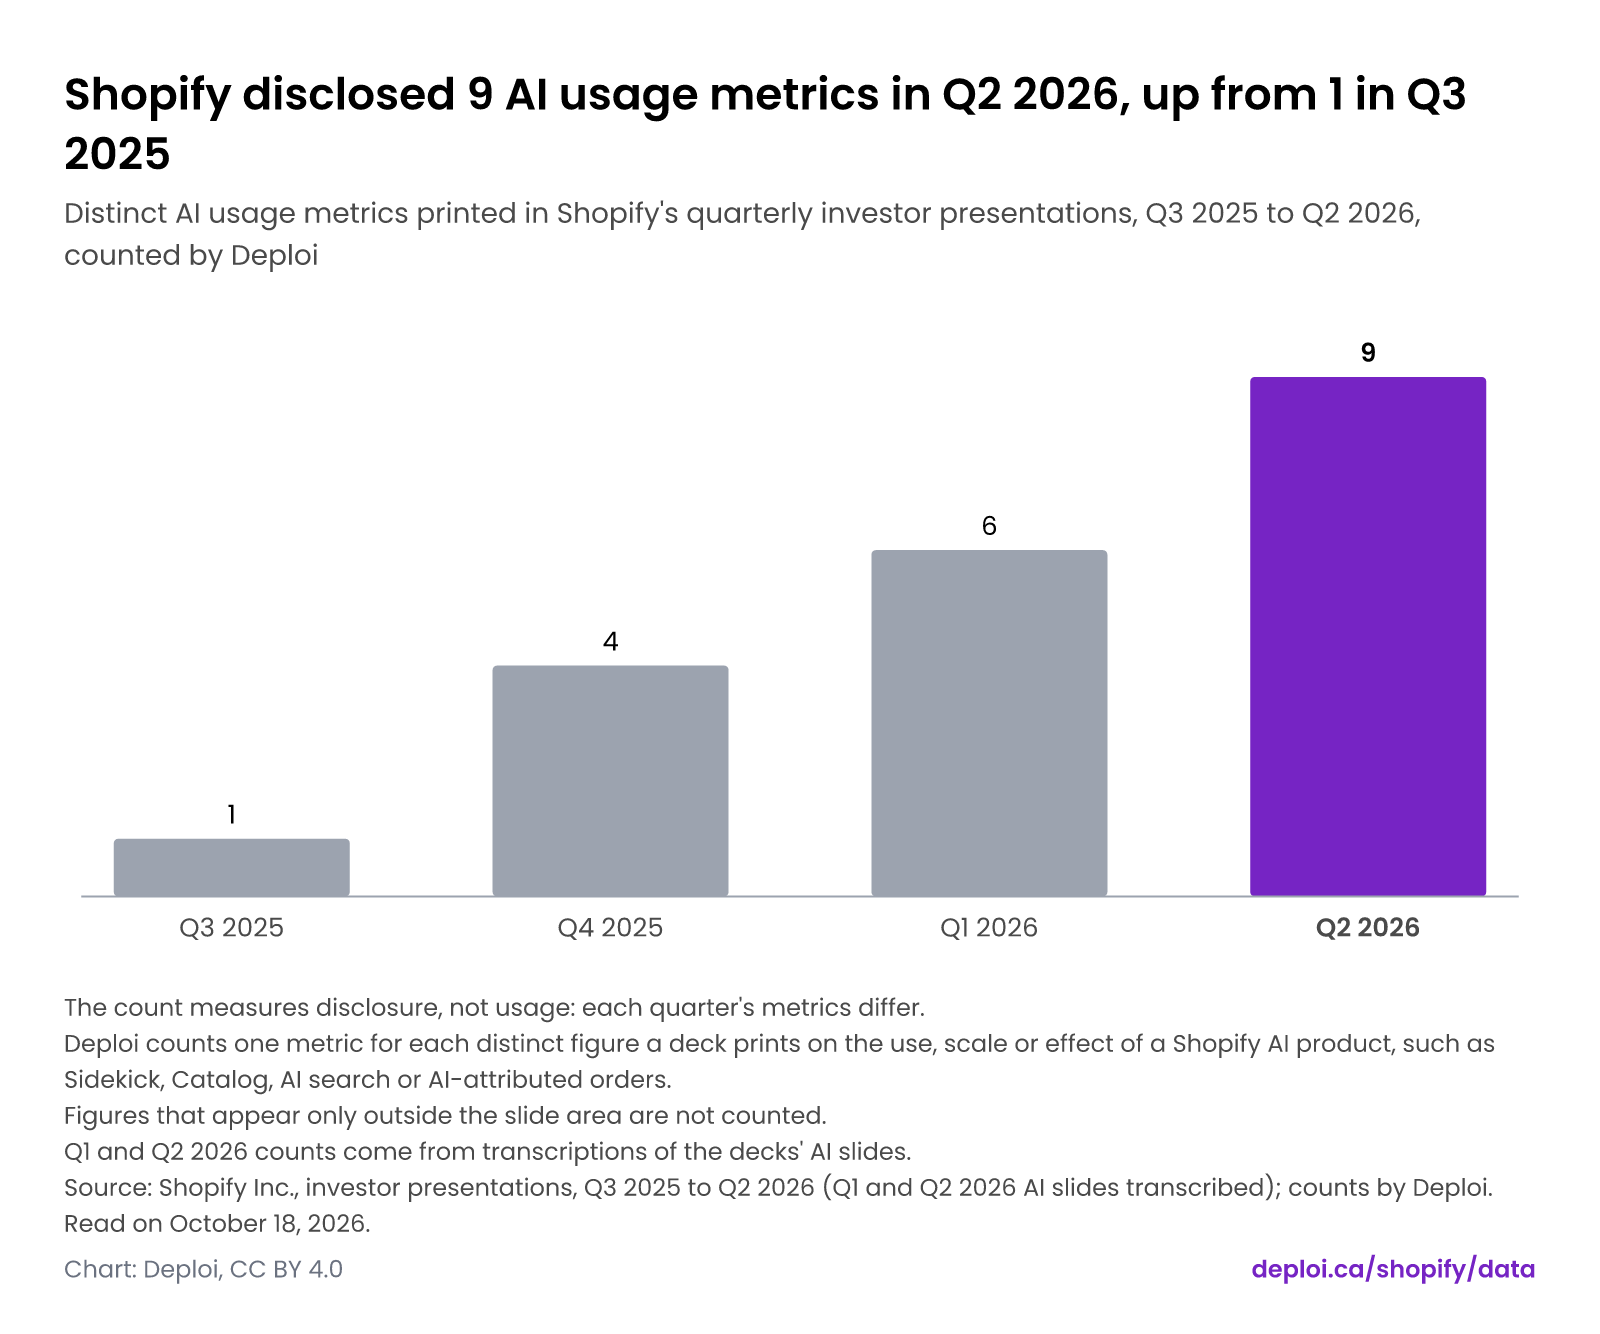
Shopify printed 9 AI usage metrics in its Q2 2026 investor presentation, up from 6 in Q1 2026, 4 in Q4 2025 and 1 in Q3 2025, counted by Deploi from the slides. The count measures disclosure, not usage, because each quarter's metrics differ. None of the figures is a dollar or order total for AI-attributed sales.
Shopify disclosed 9 AI usage metrics in Q2 2026, up from 1 in Q3 2025
Distinct AI usage metrics printed in Shopify's quarterly investor presentations, Q3 2025 to Q2 2026, counted by Deploi
- The count measures disclosure, not usage: each quarter's metrics differ.
- Deploi counts one metric for each distinct figure a deck prints on the use, scale or effect of a Shopify AI product, such as Sidekick, Catalog, AI search or AI-attributed orders.
- Figures that appear only outside the slide area are not counted.
- Q1 and Q2 2026 counts come from transcriptions of the decks' AI slides.
Source: Shopify Inc., investor presentations, Q3 2025 to Q2 2026 (Q1 and Q2 2026 AI slides transcribed); counts by Deploi. Read on .
What this means for your decision
- Sizing agentic commerce for a budget? Shopify's Q2 2026 investor presentation prints orders from AI searches up 3x year over year and 75% of AI-attributed orders from outside the top 100 categories, but no order count or sales total. Use the multiples as direction; do not turn them into a channel size.
- Reading the rise from 1 metric to 9? Deploi counts 1 AI usage metric in Shopify's Q3 2025 investor presentation, 4 in Q4 2025, 6 in Q1 2026 and 9 in Q2 2026. The count shows how much Shopify chose to disclose, not how much merchants use AI, because each quarter's metrics differ.
- Comparing a figure across quarters? Check the wording and the window first. Custom apps appear as almost 4,000 in the three weeks after Winter ‘26 Editions, in the Q4 2025 deck, then 12,000+ in Q1 2026 and 36,000 in Q2 2026. Shopify's Q2 2026 slide sets the 36,000 against 12,000 in Q1, but the Q4 2025 window differs, so the three do not form one series.
- Quoting a Shopify AI figure? Keep Shopify's wording and qualifier, such as "almost" or "1B+", and name the quarter's deck. Daily active merchants "up (3.6x YoY)" is a Q2 2026 growth multiple, not a count of merchants.
How many AI usage metrics does Shopify disclose each quarter?
Shopify's investor presentations disclosed 1 AI usage metric in Q3 2025, 4 in Q4 2025, 6 in Q1 2026 and 9 in Q2 2026, counted by Deploi. Each count is the number of distinct figures a quarter's slides print on the use, scale or effect of a Shopify AI product. Figures outside the slide area are not counted.
The count is a measure of how much Shopify says, not of how much AI is used. Each quarter's metrics differ, so the bars are not a growth series.
What did Shopify disclose about AI in the second half of 2025?
Shopify's Q3 2025 disclosure was one figure: 750k+ merchants used Sidekick for the first time in Q3, as printed in its investor presentation. Q4 2025 added four, each measured in the three weeks after Winter ‘26 Editions: almost 4,000 custom apps generated, 29,000+ Flow automations, 1.2M+ photos edited and almost 355,000 to-do lists.
All five figures relate to Sidekick. Shopify prints them as counts of things merchants did, and the log holds no total of merchants using the tool in Q4 2025.
What did Shopify add in Q1 2026?
Shopify's Q1 2026 investor presentation printed six AI figures, among them 1B+ products structured in Shopify Catalog, 12,000+ custom apps created in Q1 alone, weekly active shops using Sidekick up 4x year over year, and theme edits up 1,000% in Q1. It also gave a 2x conversion figure for Catalog-powered AI searches.
The slide says "Traffic from Catalog-powered AI searches converted 2x more than traffic from a general AI search". It also says "Nearly half of all Shopify Flows generated in Q1 were built with Sidekick".
What did Shopify add in Q2 2026?
Shopify's Q2 2026 investor presentation printed nine AI figures, led by 34M Sidekick conversations and 36,000 custom apps created using Sidekick. It added AI commerce figures: orders originating from AI searches up 3x year over year, AI traffic to merchant storefronts up 3x, and a 2x new buyer order rate against other channels.
Daily active merchants using Sidekick were "up (3.6x YoY)". Catalog held at 1B+ products, and 75% of AI-attributed orders came from outside the top 100 categories, as Shopify prints it.
Do the disclosures show how much AI commerce volume there is?
Shopify's AI commerce disclosures show growth multiples and shares, not volume. The Q2 2026 presentation prints orders from AI searches up 3x year over year and 75% of AI-attributed orders from outside the top 100 categories, but the log holds no order count, sales total or share of gross merchandise volume. Without a base, a multiple cannot size the channel.
The log holds no starting figure for any of the multiples. Treat them as direction, and look for a dollar figure before you size an investment.
Can the figures be compared from quarter to quarter?
Most figures cannot be compared across quarters, because Shopify changes the metric, the window or the comparison each time. Custom apps appear three times: almost 4,000 in the three weeks after Winter ‘26 Editions, 12,000+ in Q1 2026 and 36,000 in Q2 2026, which Shopify's Q2 slide sets against 12,000 in Q1. Catalog's 1B+ products is the one figure repeated unchanged in Q1 and Q2 2026.
Catalog's 2x conversion figure is compared with a general AI search in Q1 2026 and with scraped data in Q2 2026, so the two 2x figures answer different questions.
How does Deploi count the metrics?
Deploi counts one metric for each distinct figure a quarter's investor presentation prints on the use, scale or effect of a Shopify AI product, such as Sidekick, Catalog, AI search or AI-attributed orders. A figure that appears only in text outside the slide area is not counted. The Q1 and Q2 2026 counts come from transcriptions of the decks' AI slides.
The statements on this page are quoted as Shopify prints them. Deploi counts and groups them but adds no estimate.
The data
Each chart on this page is drawn from the numbers below. Units are in the column headers.
| Quarter | AI metrics disclosed |
|---|---|
| Q3 2025 | 1 |
| Q4 2025 | 4 |
| Q1 2026 | 6 |
| Q2 2026 | 9 |
Download AI and agentic-commerce usage figures Shopify has disclosed, by quarter as CSV · All 6 columns on the dataset page
Methodology
Reading the chart: Shopify disclosed 9 AI usage metrics in Q2 2026, up from 1 in Q3 2025
- The count measures disclosure, not usage: each quarter's metrics differ.
- Deploi counts one metric for each distinct figure a deck prints on the use, scale or effect of a Shopify AI product, such as Sidekick, Catalog, AI search or AI-attributed orders.
- Figures that appear only outside the slide area are not counted.
- Q1 and Q2 2026 counts come from transcriptions of the decks' AI slides.
Caveats: AI and agentic-commerce usage figures Shopify has disclosed, by quarter
- The count measures disclosure, not usage. Each quarter's metrics differ, so the counts are not a growth series.
- Deploi counts one metric for each distinct figure a deck prints on the use, scale or effect of a Shopify AI product, such as Sidekick, Catalog, AI search or AI-attributed orders.
- A figure that appears only in text outside the slide area is not counted or logged.
- Q1 and Q2 2026 rows come from transcriptions of the decks' AI slides; wording and qualifiers are as printed.
- The log holds growth multiples and shares. It holds no order count, sales total or share of gross merchandise volume for AI-attributed sales.
- The same wording can cover different windows or comparisons in different quarters, so figures repeated across quarters are not like for like.
Deploi's charts and compilation are licensed CC BY 4.0. The underlying facts belong to their sources, which are named on every page. How Deploi Shopify Data works.
Sources
Tier A sources are primary documents: filings, official releases and official price pages. How sources are ranked.
- Tier AShopify Q1 2026 investor presentation (Investor Overview Deck, condensed)
Shopify · PDF · Read on
- Tier AShopify Q2 2026 investor presentation
Shopify · PDF · Read on
- Tier AShopify Inc., Investor Overview presentation, Q3 2025
Shopify Inc. · PDF · Read on
- Tier AShopify Inc., Investor Overview presentation, Q4 2025
Shopify Inc. · PDF · Read on
Cite and reuse
Deploi's charts and compilation are licensed CC BY 4.0. The underlying facts belong to their sources, which are named on every page.
APA
Deploi. (2026). What has Shopify disclosed about AI and agentic commerce usage, quarter by quarter? [Web page]. https://deploi.ca/shopify/data/shopify-ai-usage-disclosures Retrieved October 18, 2026.
BibTeX
@misc{deploi_shopify_ai_usage_disclosures_2026,
  author = {{Deploi}},
  title = {What has Shopify disclosed about AI and agentic commerce usage, quarter by quarter?},
  year = {2026},
  url = {https://deploi.ca/shopify/data/shopify-ai-usage-disclosures},
  note = {Accessed 2026-10-18}
}
Embed this chart
Embed code
<iframe src="https://deploi.ca/embed/shopify/data/shopify-ai-metrics-by-quarter" title="Shopify disclosed 9 AI usage metrics in Q2 2026, up from 1 in Q3 2025" loading="lazy" style="width:100%;height:550px;border:0"></iframe>
<p style="font:12px/1.4 Arial,sans-serif;margin:4px 0 0">Source: <a href="https://deploi.ca/shopify/data/shopify-ai-usage-disclosures#chart-shopify-ai-metrics-by-quarter">Deploi, Shopify disclosed 9 AI usage metrics in Q2 2026, up from 1 in Q3 2025</a></p>
Keep the credit line under the embed. It is the license condition.
Questions
How many AI metrics did Shopify disclose in Q2 2026?
Shopify's Q2 2026 investor presentation printed 9 AI usage metrics, counted by Deploi, up from 6 in Q1 2026, 4 in Q4 2025 and 1 in Q3 2025. The count measures how much Shopify discloses, not how much AI is used.
How many Sidekick conversations has Shopify reported?
Shopify's Q2 2026 investor presentation prints "Sidekick conversations" at 34M. The same deck prints daily active merchants "up (3.6x YoY)" and 36,000 custom apps created using Sidekick.
Does Shopify say how many orders come from AI search?
Not as a total. Shopify's Q2 2026 investor presentation prints orders originating from AI searches at 3x year over year and 75% of AI-attributed orders from outside the top 100 categories, with no order count or sales total.
Is the growth in disclosed metrics the same as growth in AI usage?
No. The count rose from 1 in Q3 2025 to 9 in Q2 2026, but each quarter's metrics differ, so the count shows how much Shopify discloses. It is not a measure of usage.
Is Deploi affiliated with Shopify?
No. Deploi is not a Shopify Partner and not affiliated with Shopify. The figures on this page are quoted from Shopify's investor presentations for Q3 2025 to Q2 2026, and the metric counts are Deploi's own.
More on Performance and technology
- How do the agentic commerce protocols compare on launch dates, backers, surfaces and merchant requirements?
UCP, ACP, Shopify Catalog and Shopify Agentic Storefronts launched between May 21, 2025 and January 11, 2026; ACP listed 5 spec versions and UCP 4 on October 18, 2026. Updated October 19, 2026.
- Which Shopify deprecations and deadlines land in the next 12 months, and which have already passed?
Five dated Shopify deadlines in Deploi's dataset fall in the next 12 months, from January 16 to October 16, 2027; the other 12 have passed. Updated October 19, 2026.
- Do Hydrogen storefronts pass Core Web Vitals more often than Shopify sites overall?
In HTTP Archive's September 2026 mobile data, 50% of Hydrogen origins pass the Core Web Vitals assessment against 76% of all detected Shopify origins, computed by Deploi. Updated October 18, 2026.
- How many sites publish an llms.txt file, and who is publishing them?
Valid llms.txt files appeared on 2.13% of desktop sites and 2.1% of mobile sites in the Web Almanac 2025 crawl, and the Almanac traces 39.6% of llms.txt files to All in One SEO. Updated October 18, 2026.
- How many sites run Hydrogen on Shopify, and is the share rising?
Hydrogen runs on 0.34% of Shopify sites in HTTP Archive's September 2026 crawl, up from 0.19% in January 2025, computed by Deploi. Updated October 18, 2026.
- How many themes does the Shopify Theme Store list, and how many are free?
The Shopify Theme Store lists 1,326 themes, and only 24 are free, according to its own filter counts on October 18, 2026. Updated October 18, 2026.
Changes
- · AI and agentic-commerce usage figures Shopify has disclosed, by quarter
First release. Metrics read from Shopify's investor presentations for Q3 2025 to Q2 2026 on October 18, 2026, with the per-quarter counts computed by Deploi.