
How much of US wholesale and manufacturing sales go through ecommerce?
E-commerce was 66.6% of US manufacturing shipments and 35.1% of merchant wholesale sales in 2024, on a Census definition that counts EDI orders. Updated November 19, 2026.
By Martin DejnickiUpdated Data through 2024
Short answer
E-commerce accounted for 66.6% of US manufacturing shipments and 35.1% of merchant wholesale sales in 2024, according to the U.S. Census Bureau's Annual Integrated Economic Survey. Census counts orders placed over EDI networks as e-commerce, and these tables do not split EDI from web orders, so the shares are not web-store shares.
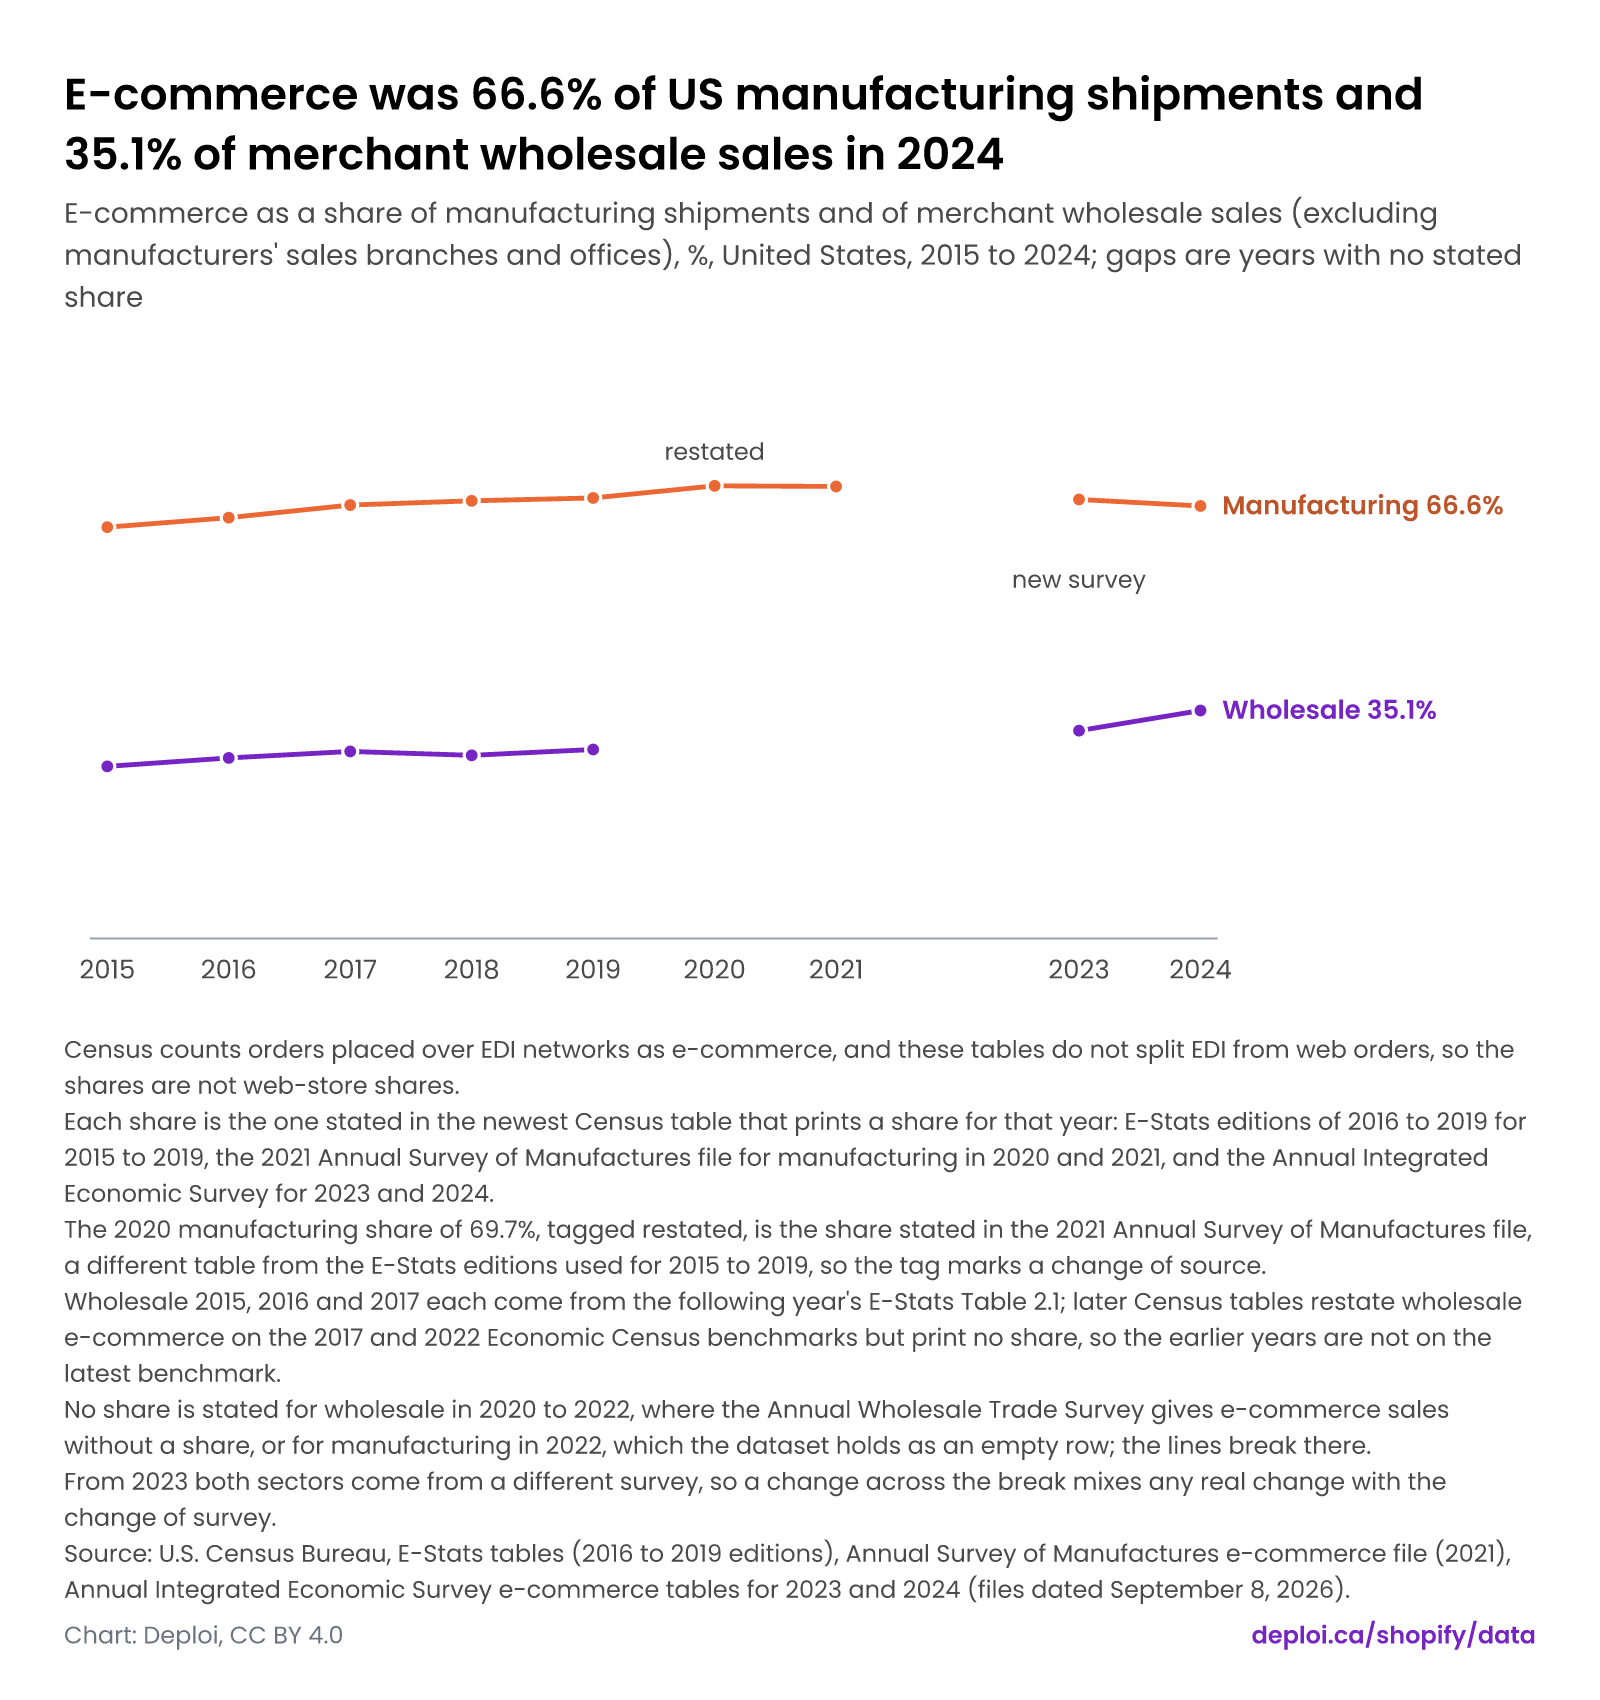
E-commerce was 66.6% of US manufacturing shipments and 35.1% of merchant wholesale sales in 2024
E-commerce as a share of manufacturing shipments and of merchant wholesale sales (excluding manufacturers' sales branches and offices), %, United States, 2015 to 2024; gaps are years with no stated share
- Census counts orders placed over EDI networks as e-commerce, and these tables do not split EDI from web orders, so the shares are not web-store shares.
- Each share is the one stated in the newest Census table that prints a share for that year: E-Stats editions of 2016 to 2019 for 2015 to 2019, the 2021 Annual Survey of Manufactures file for manufacturing in 2020 and 2021, and the Annual Integrated Economic Survey for 2023 and 2024.
- The 2020 manufacturing share of 69.7%, tagged restated, is the share stated in the 2021 Annual Survey of Manufactures file, a different table from the E-Stats editions used for 2015 to 2019, so the tag marks a change of source.
- Wholesale 2015, 2016 and 2017 each come from the following year's E-Stats Table 2.1; later Census tables restate wholesale e-commerce on the 2017 and 2022 Economic Census benchmarks but print no share, so the earlier years are not on the latest benchmark.
- No share is stated for wholesale in 2020 to 2022, where the Annual Wholesale Trade Survey gives e-commerce sales without a share, or for manufacturing in 2022, which the dataset holds as an empty row; the lines break there.
- From 2023 both sectors come from a different survey, so a change across the break mixes any real change with the change of survey.
Source: U.S. Census Bureau, E-Stats tables (2016 to 2019 editions), Annual Survey of Manufactures e-commerce file (2021), Annual Integrated Economic Survey e-commerce tables for 2023 and 2024 (files dated September 8, 2026). Read on .
Does Census separate EDI from web ordering?
No. Census counts orders placed over computer networks, including EDI, as e-commerce, and the tables read for this page state no EDI share, so the share of e-commerce that is EDI rather than web ordering cannot be given. The EDI column is empty for all 20 rows, 10 for manufacturing and 10 for wholesale, from 2015 to 2024.
The shares are therefore not web-store shares. They include EDI orders, and they do not isolate orders placed on a merchant's own website.
Tables that split EDI from other networks are not in the sources read, so the dataset leaves the EDI column empty.
How has manufacturing's ecommerce share changed since 2015?
E-commerce was 63.3% of US manufacturing shipments in 2015 and 69.7% in 2020, the highest value in the dataset, and 66.6% in 2024, according to U.S. Census Bureau E-Stats, Annual Survey of Manufactures and Annual Integrated Economic Survey tables. The dataset holds no value for 2022, so the line breaks there.
Manufacturing shares by year, percent of shipments:
| Year | Share |
|---|---|
| 2015 | 63.3% |
| 2016 | 64.8% |
| 2017 | 66.7% |
| 2018 | 67.4% |
| 2019 | 67.8% |
| 2020 | 69.7% |
| 2021 | 69.6% |
| 2022 | no value |
| 2023 | 67.6% |
| 2024 | 66.6% |
The source changes in 2023, so the fall from 69.6% in 2021 to 67.6% in 2023 mixes any real change with the change of survey.
How has wholesale's ecommerce share changed since 2015?
E-commerce was 26.5% of US merchant wholesale sales in 2015 and 29.1% in 2019, according to U.S. Census Bureau E-Stats tables, and 32.0% in 2023 and 35.1% in 2024 according to the Annual Integrated Economic Survey. No share is stated for 2020 to 2022, so the line breaks there.
Wholesale shares by year: 26.5% in 2015, 27.8% in 2016, 28.8% in 2017, 28.2% in 2018 and 29.1% in 2019.
For 2020 to 2022 the Census Bureau's Annual Wholesale Trade Survey gives e-commerce sales without a share: $1,831.7 billion in 2020, $2,080.2 billion in 2021 and $2,297.2 billion in 2022. Census flags the 2022 estimate for a low response rate (37.3%) and advises caution in drawing conclusions from it. They are not turned into shares here, because the dataset holds no wholesale sales total for those years.
Are the 2015 to 2024 shares comparable from year to year?
The 2015 to 2024 shares are not strictly comparable, because they come from different U.S. Census Bureau tables, each the newest to print a share for that year: E-Stats editions of 2016 to 2019 for 2015 to 2019, the 2021 Annual Survey of Manufactures file for manufacturing in 2020 and 2021, and the Annual Integrated Economic Survey for 2023 and 2024.
Wholesale 2015, 2016 and 2017 each come from the following year's E-Stats Table 2.1. Later Census tables restate wholesale e-commerce on the 2017 and 2022 Economic Census benchmarks but print no share, so the earlier wholesale years are not on the latest benchmark.
From 2023 both sectors come from a different survey, so a change across that break mixes real change with the change of survey.
What do the manufacturing and wholesale series cover?
The manufacturing series is the value of shipments, and the wholesale series is the sales of merchant wholesalers, except manufacturers' sales branches and offices, according to the U.S. Census Bureau's E-Stats and Annual Integrated Economic Survey tables. The 2023 and 2024 e-commerce tables cover employer firms in the United States.
E-commerce is measured as Census defines it: orders placed over computer networks, including EDI. The dataset holds sector totals only, so it does not give the share for any one industry or company.
Retail e-commerce is a separate Census series with its own definition. See the US retail e-commerce share by quarter.
The data
Each chart on this page is drawn from the numbers below. Units are in the column headers.
Methodology
Reading the chart: E-commerce was 66.6% of US manufacturing shipments and 35.1% of merchant wholesale sales in 2024
- Census counts orders placed over EDI networks as e-commerce, and these tables do not split EDI from web orders, so the shares are not web-store shares.
- Each share is the one stated in the newest Census table that prints a share for that year: E-Stats editions of 2016 to 2019 for 2015 to 2019, the 2021 Annual Survey of Manufactures file for manufacturing in 2020 and 2021, and the Annual Integrated Economic Survey for 2023 and 2024.
- The 2020 manufacturing share of 69.7%, tagged restated, is the share stated in the 2021 Annual Survey of Manufactures file, a different table from the E-Stats editions used for 2015 to 2019, so the tag marks a change of source.
- Wholesale 2015, 2016 and 2017 each come from the following year's E-Stats Table 2.1; later Census tables restate wholesale e-commerce on the 2017 and 2022 Economic Census benchmarks but print no share, so the earlier years are not on the latest benchmark.
- No share is stated for wholesale in 2020 to 2022, where the Annual Wholesale Trade Survey gives e-commerce sales without a share, or for manufacturing in 2022, which the dataset holds as an empty row; the lines break there.
- From 2023 both sectors come from a different survey, so a change across the break mixes any real change with the change of survey.
Caveats: E-commerce share of US manufacturing shipments and merchant wholesale sales, 2015 to 2024
- Census counts orders placed over computer networks, including EDI, as e-commerce. These tables do not split EDI from web orders, so the share via EDI is empty for every row and the shares are not web-store shares.
- Each share is the one stated in the newest Census table that prints a share for that year: E-Stats editions of 2016 to 2019 for 2015 to 2019, the 2021 Annual Survey of Manufactures file for manufacturing in 2020 and 2021, and the Annual Integrated Economic Survey for 2023 and 2024.
- Wholesale 2015, 2016 and 2017 each come from the following year's E-Stats Table 2.1. Later Census tables restate wholesale e-commerce on the 2017 and 2022 Economic Census benchmarks but print no share, so the earlier wholesale years are not on the latest benchmark.
- No share is stated for wholesale in 2020 to 2022, where the Annual Wholesale Trade Survey gives e-commerce sales without a share and the dataset holds no total. The manufacturing 2022 row is empty. Census flags the 2022 wholesale e-commerce estimate for a 37.3% response rate and advises caution in drawing conclusions from it.
- From 2023 both sectors come from a different survey, so a change across the break mixes any real change with the change of survey.
- The release date is empty for 2020, 2023 and 2024 because the sources read do not state a release date for those values.
Deploi's charts and compilation are licensed CC BY 4.0. The underlying facts belong to their sources, which are named on every page. How Deploi Shopify Data works.
Sources
Tier A sources are primary documents: filings, official releases and official price pages. How sources are ranked.
Cite and reuse
Deploi's charts and compilation are licensed CC BY 4.0. The underlying facts belong to their sources, which are named on every page.
APA
Deploi. (2026). How much of US wholesale and manufacturing sales go through ecommerce? [Web page]. https://deploi.ca/shopify/data/us-b2b-ecommerce-share Retrieved November 19, 2026.
BibTeX
@misc{deploi_us_b2b_ecommerce_share_2026,
  author = {{Deploi}},
  title = {How much of US wholesale and manufacturing sales go through ecommerce?},
  year = {2026},
  url = {https://deploi.ca/shopify/data/us-b2b-ecommerce-share},
  note = {Accessed 2026-11-19}
}
Embed this chart
Embed code
<iframe src="https://deploi.ca/embed/shopify/data/us-b2b-ecommerce-share-by-year" title="E-commerce was 66.6% of US manufacturing shipments and 35.1% of merchant wholesale sales in 2024" loading="lazy" style="width:100%;height:550px;border:0"></iframe>
<p style="font:12px/1.4 Arial,sans-serif;margin:4px 0 0">Source: <a href="https://deploi.ca/shopify/data/charts/us-b2b-ecommerce-share-by-year">Deploi, E-commerce was 66.6% of US manufacturing shipments and 35.1% of merchant wholesale sales in 2024</a></p>
Keep the credit line under the embed. It is the license condition.
Questions
What share of US manufacturing is ecommerce?
E-commerce was 66.6% of US manufacturing shipments in 2024, according to the U.S. Census Bureau's Annual Integrated Economic Survey. It was 67.6% in 2023. Census counts EDI orders as e-commerce, so the share is not a web-store share.
What share of US wholesale sales is ecommerce?
E-commerce was 35.1% of US merchant wholesale sales in 2024 and 32.0% in 2023, according to the U.S. Census Bureau's Annual Integrated Economic Survey. The wholesale series excludes manufacturers' sales branches and offices.
Is B2B ecommerce the same as web ordering?
No. The U.S. Census Bureau counts orders placed over computer networks, including EDI, as e-commerce. The tables read for this page do not split EDI from web orders, so the 2024 shares of 66.6% and 35.1% cannot be read as web-ordering shares.
Why is there no 2022 figure for manufacturing?
The dataset holds 2022 for manufacturing as an empty row, because the Census tables read state no manufacturing e-commerce share for that year. The chart line breaks there, and the 2021 and 2023 values come from different surveys.
Are earlier wholesale years on the same basis as 2024?
No. Wholesale 2015 to 2017 come from E-Stats editions, and the U.S. Census Bureau has since restated wholesale e-commerce on the 2017 and 2022 Economic Census benchmarks without printing a share. The 2023 and 2024 values come from the Annual Integrated Economic Survey.
More on Merchant benchmarks
- What are the B2B limits on each Shopify plan?
Seven of the 24 B2B features Shopify marks by plan are not on Basic: 5 are Plus only and 2 are on Advanced and Plus, per Shopify's Help Center read October 18, 2026. Basic, Grow and Advanced allow up to 3 active B2B catalogs. Updated November 19, 2026.
- What do fulfillment warehouse workers earn by Canadian province and in the US?
Alberta has Canada's highest median wage for material handlers, C$24.00 an hour, and Newfoundland and Labrador the lowest, C$19.94, per Job Bank wage data for 2024 to 2025. Updated November 19, 2026.
- What do returns apps cost at 500, 2,000 and 10,000 returns a month?
At 2,000 returns a month Return Prime costs $909 and AfterShip $1,009, while Redo's listing shows a $0 plan fee with per-return charges not stated and Loop publishes no volume price, computed by Deploi from prices read by November 18, 2026. Updated November 19, 2026.
- What share of US retail sales is ecommerce, quarter by quarter?
E-commerce was 17.9% of US retail sales in Q3 2026, seasonally adjusted and preliminary, the highest share in a Census series that starts in Q4 1999. Updated November 19, 2026.
- How have de minimis duty-free thresholds changed in the US, EU, UK and Canada, and what does that mean for cross-border Shopify orders?
The US suspended duty-free de minimis treatment for all countries on August 29, 2025, and the EU ended its EUR 150 duty exemption on June 30, 2026. Updated November 18, 2026.
- What do Shopify's published checkout conversion-lift claims say, and what evidence is behind each?
Shopify's pages claim checkout conversion lifts of 3.5% to 50%, including up to 36% over rivals and 15% on average, and none of its 9 checkout claims states a sample size. Updated November 18, 2026.
Changes
- · E-commerce share of US manufacturing shipments and merchant wholesale sales, 2015 to 2024
First published.