
What share of US retail sales is ecommerce, quarter by quarter?
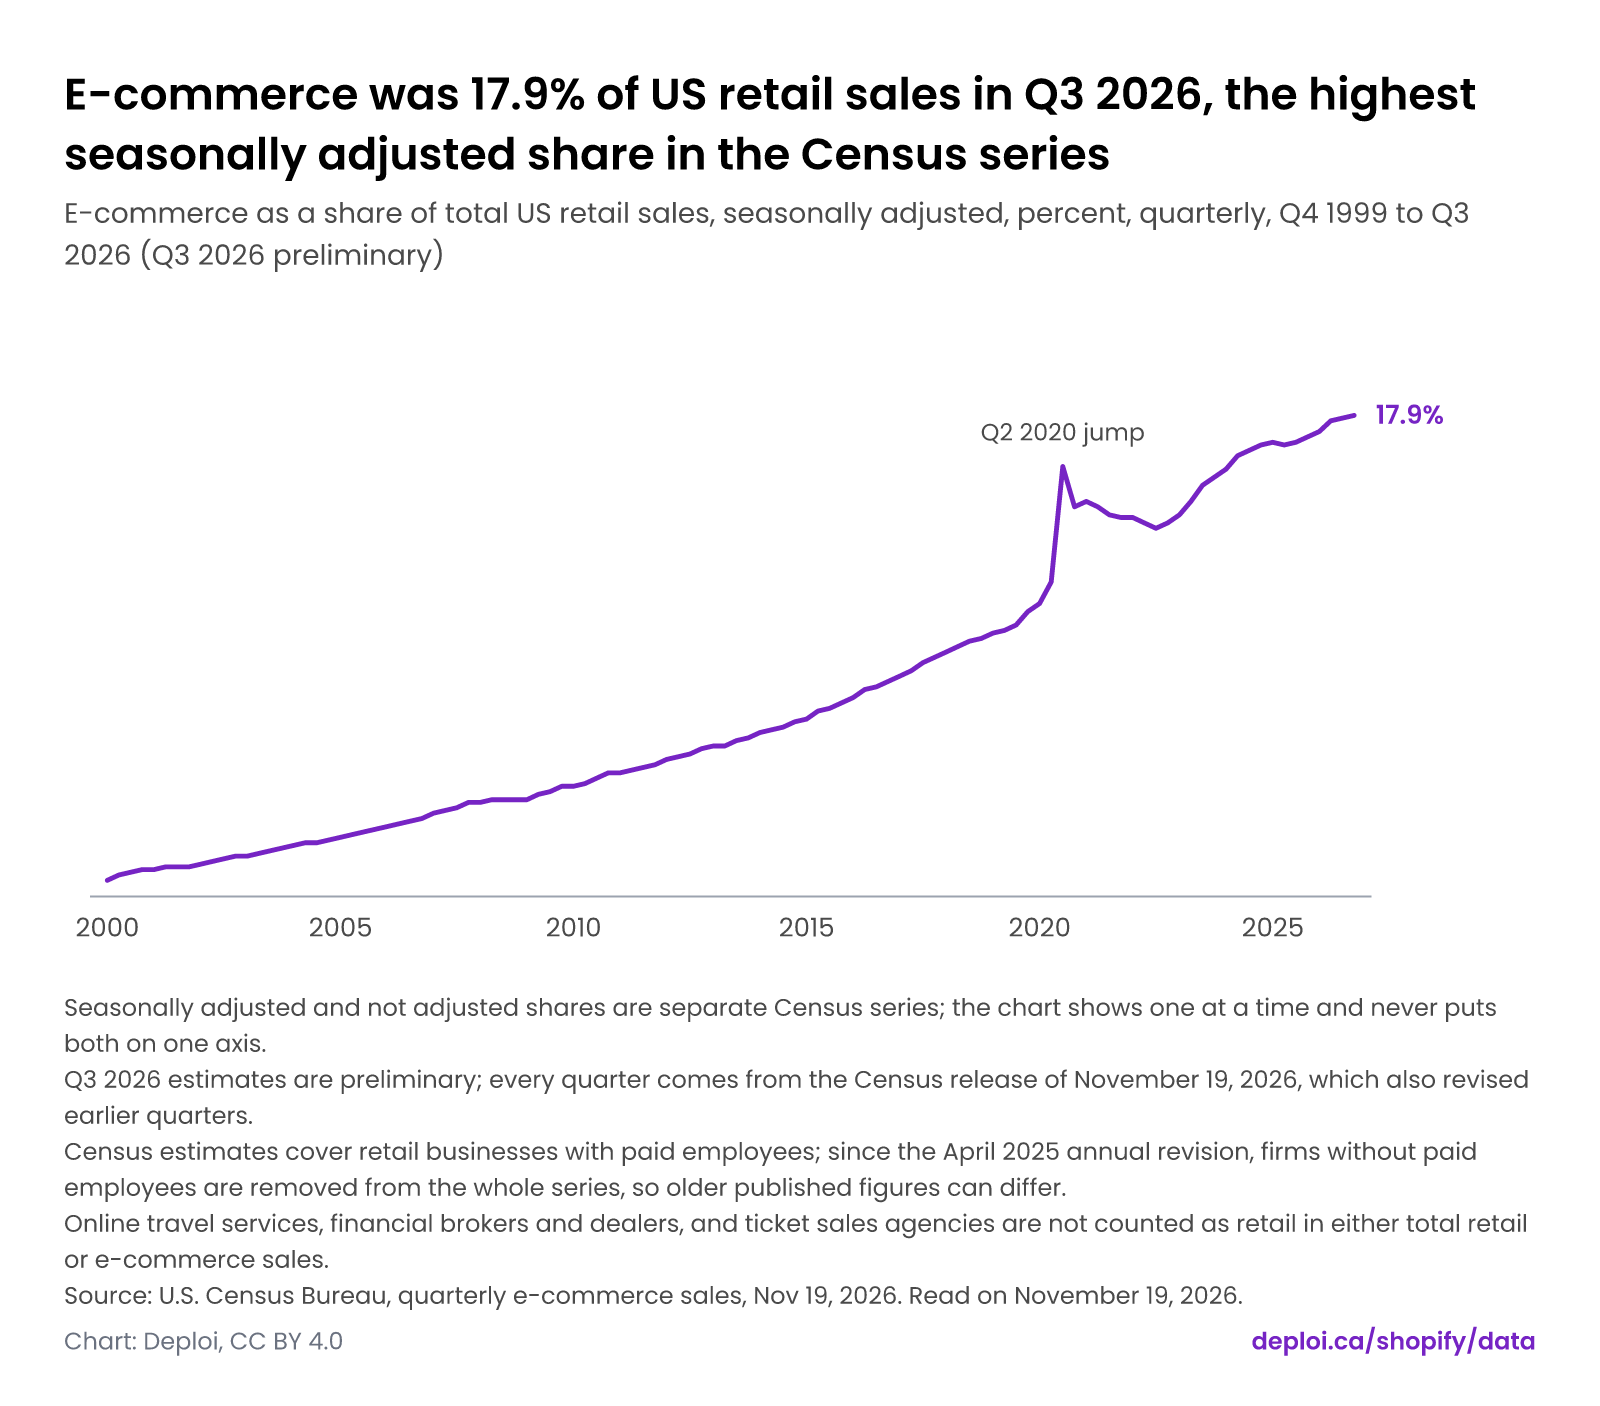
E-commerce was 17.9% of US retail sales in Q3 2026, seasonally adjusted and preliminary, the highest share in a Census series that starts in Q4 1999. Updated November 19, 2026.
By Martin DejnickiUpdated Data through September 2026
Short answer
E-commerce was 17.9% of US retail sales in Q3 2026 on a seasonally adjusted basis, up from 17.1% in Q3 2025, according to the U.S. Census Bureau's quarterly e-commerce release of November 19, 2026. It is the highest share in the series, which starts at 0.6% in Q4 1999. Census marks the Q3 2026 estimate preliminary.
E-commerce was 17.9% of US retail sales in Q3 2026, the highest seasonally adjusted share in the Census series
E-commerce as a share of total US retail sales, seasonally adjusted, percent, quarterly, Q4 1999 to Q3 2026 (Q3 2026 preliminary)
Seasonally adjusted e-commerce share of US retail sales, by quarter
E-commerce share of US retail sales in Q3 2026, by series
- Seasonally adjusted
- 17.9%Seasonally adjusted: e-commerce was 17.9% of US retail sales in Q3 2026, against 17.1% in Q3 2025. Use this series to compare one quarter with the next.
- Not adjusted
- 17.2%Not adjusted: e-commerce was 17.2% of US retail sales in Q3 2026 and peaks each fourth quarter, at 18.9% in Q4 2025. Compare a quarter only with the same quarter of another year.
- Seasonally adjusted and not adjusted shares are separate Census series; the chart shows one at a time and never puts both on one axis.
- Q3 2026 estimates are preliminary; every quarter comes from the Census release of November 19, 2026, which also revised earlier quarters.
- Census estimates cover retail businesses with paid employees; since the April 2025 annual revision, firms without paid employees are removed from the whole series, so older published figures can differ.
- Online travel services, financial brokers and dealers, and ticket sales agencies are not counted as retail in either total retail or e-commerce sales.
Source: U.S. Census Bureau, quarterly e-commerce sales, Nov 19, 2026. Read on .
What share of US retail sales was ecommerce in the latest quarter?
Seasonally adjusted, e-commerce was 17.9% of US retail sales in Q3 2026, or $347,322 million of $1,941,858 million, according to the U.S. Census Bureau's release of November 19, 2026. The not seasonally adjusted share was 17.2%. Census treats the Q3 2026 estimates as preliminary, and the same release revised earlier quarters.
The chart shows one series at a time, with a switch between seasonally adjusted and not adjusted. They are separate Census series and are never drawn on one axis.
Seasonally adjusted, the share was 17.8% in Q2 2026 and 17.7% in Q1 2026, from the same release.
The share is for US retail as a whole, so it does not give the online share of any one category or retailer.
How has the ecommerce share of US retail changed since 1999?
Seasonally adjusted, e-commerce rose from 0.6% of US retail sales in Q4 1999 to 4.1% in Q4 2009, 10.9% in Q4 2019 and 17.9% in Q3 2026, according to the U.S. Census Bureau's time series revised November 19, 2026. The series covers 108 quarters, from Q4 1999 to Q3 2026.
Fourth-quarter snapshots, as Census states them, percent of total US retail sales:
| Quarter | Seasonally adjusted | Not adjusted |
|---|---|---|
| Q4 1999 | 0.6% | 0.7% |
| Q4 2009 | 4.1% | 4.7% |
| Q4 2019 | 10.9% | 12.1% |
| Q4 2025 | 17.3% | 18.9% |
Q3 2026 is the latest quarter: 17.9% seasonally adjusted and 17.2% not adjusted.
What did the 2020 jump do to the ecommerce share, and did it hold?
Seasonally adjusted, the e-commerce share of US retail sales rose from 11.7% in Q1 2020 to 16.0% in Q2 2020, eased to 13.7% by Q2 2022 and passed 16.0% again at 16.4% in Q1 2024, according to the U.S. Census Bureau's series revised November 19, 2026. It reached 17.9% in Q3 2026.
Not adjusted, the share was 15.2% in Q2 2020 and 13.0% in Q2 2022.
In Q2 2020, not adjusted e-commerce sales were 53.9% higher than a year earlier, while total retail sales were 3.3% lower, both computed by Deploi from Census estimates.
Why do the seasonally adjusted and not adjusted shares differ?
The two US e-commerce shares differ because the U.S. Census Bureau adjusts only one for seasonal variation. The not adjusted share peaks each fourth quarter, at 18.9% of retail sales in Q4 2025, against 17.3% seasonally adjusted. In Q3 2026 the not adjusted share was 17.2% and the seasonally adjusted share 17.9%, in the release of November 19, 2026.
Use the seasonally adjusted series to compare one quarter with the next.
Compare a not adjusted quarter only with the same quarter of another year: 17.2% in Q3 2026 against 16.5% in Q3 2025.
How fast is US ecommerce growing compared with total retail?
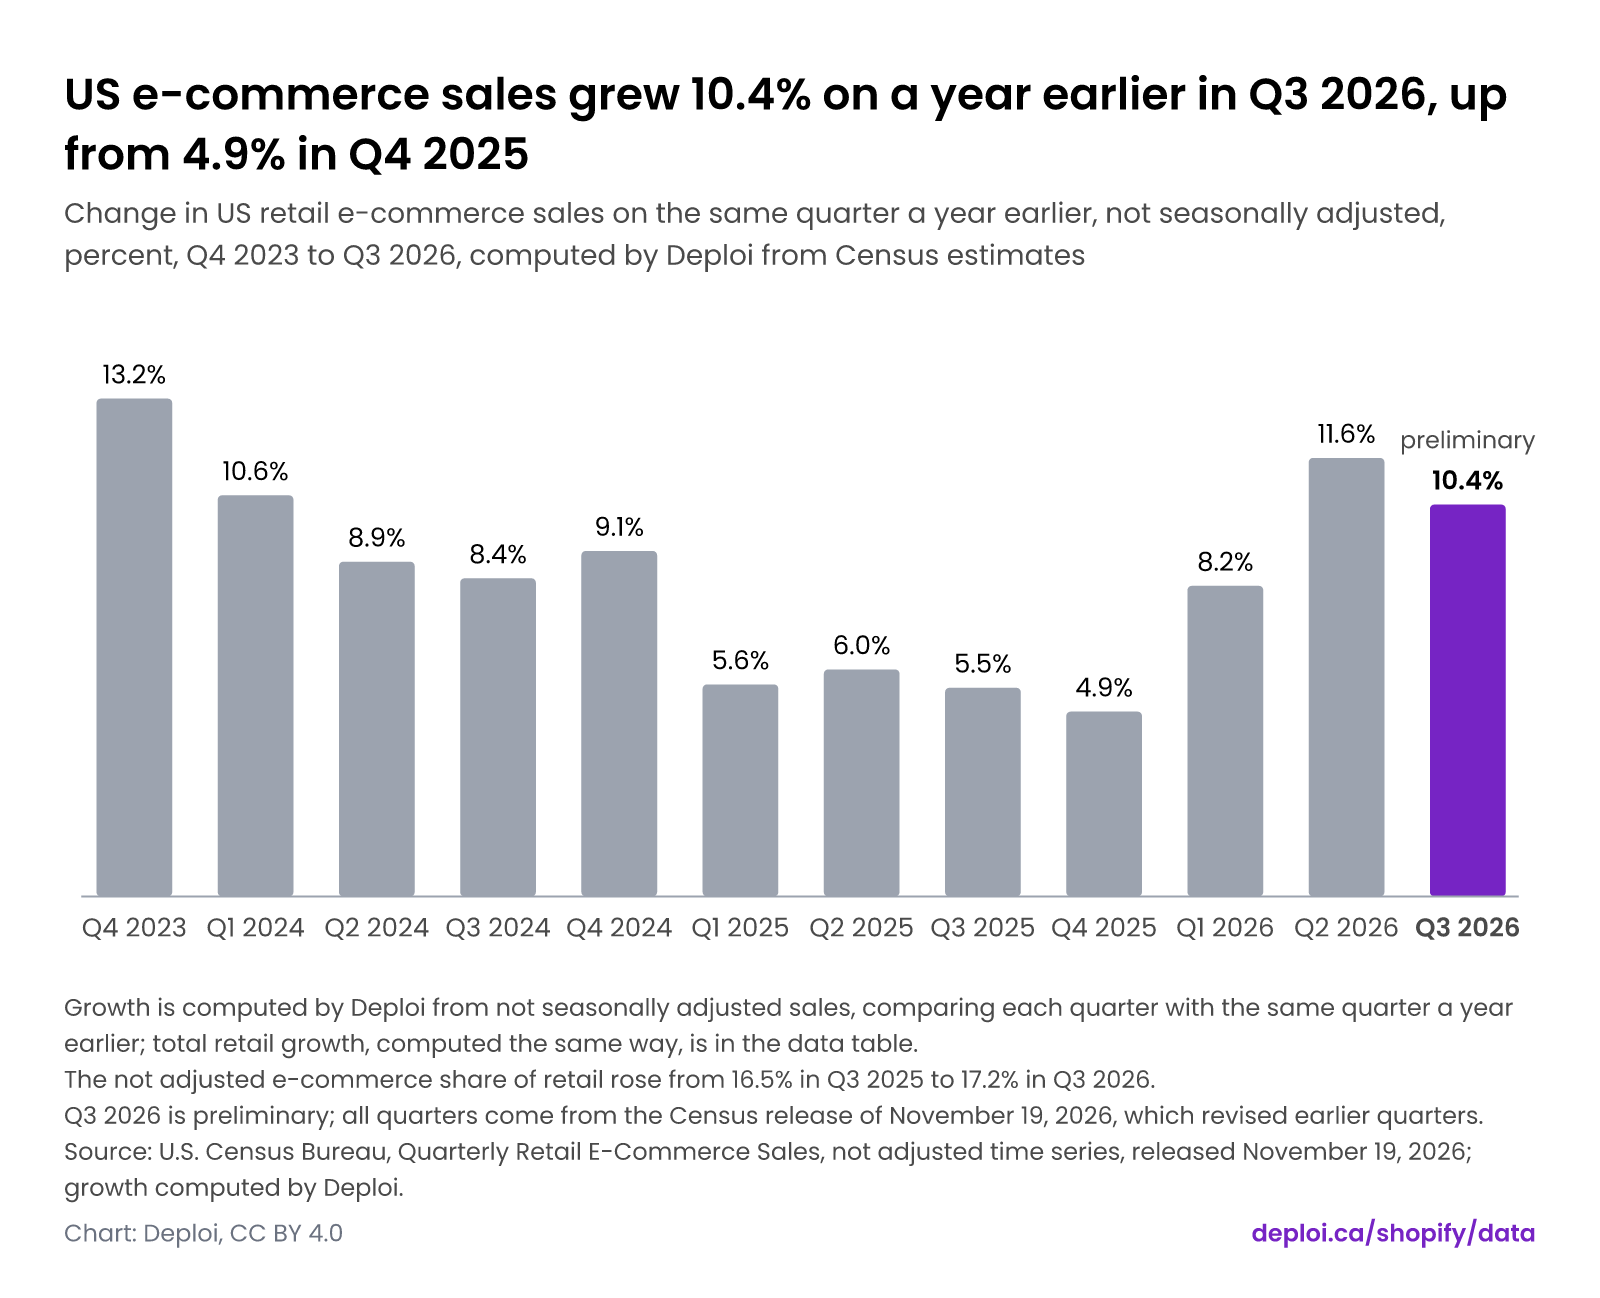
Not seasonally adjusted, US e-commerce sales grew 10.4% in Q3 2026 on a year earlier, against 5.6% for total retail sales, computed by Deploi from the U.S. Census Bureau's estimates released November 19, 2026. E-commerce growth was 4.9% in Q4 2025 and 11.6% in Q2 2026.
Each rate compares a quarter with the same quarter a year earlier, so seasonality does not distort it. In Q3 2025 the rates were 5.5% for e-commerce and 3.8% for total retail.
Q3 2026 is preliminary. Census does not adjust the estimates for price changes, so the rates measure dollar sales, not quantities sold.
US e-commerce sales grew 10.4% on a year earlier in Q3 2026, up from 4.9% in Q4 2025
Change in US retail e-commerce sales on the same quarter a year earlier, not seasonally adjusted, percent, Q4 2023 to Q3 2026, computed by Deploi from Census estimates
- Growth is computed by Deploi from not seasonally adjusted sales, comparing each quarter with the same quarter a year earlier; total retail growth, computed the same way, is in the data table.
- The not adjusted e-commerce share of retail rose from 16.5% in Q3 2025 to 17.2% in Q3 2026.
- Q3 2026 is preliminary; all quarters come from the Census release of November 19, 2026, which revised earlier quarters.
Source: U.S. Census Bureau, Quarterly Retail E-Commerce Sales, not adjusted time series, released November 19, 2026; growth computed by Deploi. Read on .
What does the Census count as retail ecommerce?
The U.S. Census Bureau's estimates cover retail businesses with paid employees, and since the April 2025 annual revision they leave out firms without paid employees for the whole series, according to its November 19, 2026 release. Online travel services, financial brokers and dealers, and ticket sales agencies are not counted as retail in either total retail or e-commerce sales.
Census counts a sale as e-commerce when the buyer places the order, or the price and terms are negotiated, over an online system. Online systems include the internet, mobile devices, extranets, electronic data interchange (EDI) networks and email. Payment may or may not be made online, according to the Census Q3 2026 publication.
Older published figures can differ because they included firms without paid employees through a benchmarking adjustment.
The dataset holds every quarter as it appears in the November 19, 2026 release, not as earlier releases published it.
How does the US share compare with Canada's?
On each agency's own series, retail e-commerce was 17.0% of US retail sales in 2025, against 7.0% for Canada, computed by Deploi from the U.S. Census Bureau's not adjusted series and Statistics Canada's monthly retail trade table. The two agencies define retail e-commerce differently, so the comparison is not like for like.
Statistics Canada counts only online sales by Canadian-based retailers and leaves out purchases by Canadians from foreign-based retailers. See the Canada and US comparison for the definitions and the 2019 to 2025 series.
The data
Each chart on this page is drawn from the numbers below. Units are in the column headers.
US e-commerce sales grew 10.4% on a year earlier in Q3 2026, up from 4.9% in Q4 2025
| Quarter label | Ecommerce sales growth on a year earlier, not adjusted (%) | Total retail sales growth on a year earlier, not adjusted (%) | Ecommerce share, not adjusted (%) |
|---|---|---|---|
| Q4 1999 | Not stated | Not stated | 0.7 |
| Q1 2000 | Not stated | Not stated | 0.8 |
| Q2 2000 | Not stated | Not stated | 0.8 |
| Q3 2000 | Not stated | Not stated | 0.9 |
| Q4 2000 | 70.2 | 3.3 | 1.2 |
| Q1 2001 | 42.1 | 1.4 | 1.1 |
| Q2 2001 | 28.4 | 3.6 | 1.0 |
| Q3 2001 | 11.1 | 1.3 | 1.0 |
| Q4 2001 | 17.8 | 4.4 | 1.3 |
| Q1 2002 | 20.9 | 1.7 | 1.3 |
| Q2 2002 | 28.8 | 1.4 | 1.3 |
| Q3 2002 | 38.3 | 4.8 | 1.4 |
| Q4 2002 | 31.6 | 0.7 | 1.7 |
| Q1 2003 | 28.1 | 3.4 | 1.7 |
| Q2 2003 | 28.7 | 3.7 | 1.6 |
| Q3 2003 | 29.2 | 5.0 | 1.7 |
| Q4 2003 | 26.3 | 5.0 | 2.0 |
| Q1 2004 | 30.5 | 7.4 | 2.0 |
| Q2 2004 | 26.3 | 6.4 | 1.9 |
| Q3 2004 | 23.6 | 5.1 | 2.0 |
| Q4 2004 | 25.4 | 7.2 | 2.4 |
| Q1 2005 | 24.3 | 5.2 | 2.4 |
| Q2 2005 | 27.4 | 7.1 | 2.2 |
| Q3 2005 | 28.4 | 7.8 | 2.3 |
| Q4 2005 | 25.2 | 5.3 | 2.8 |
| Q1 2006 | 26.5 | 7.3 | 2.8 |
| Q2 2006 | 22.6 | 5.9 | 2.6 |
| Q3 2006 | 20.8 | 4.0 | 2.7 |
| Q4 2006 | 24.7 | 3.3 | 3.4 |
| Q1 2007 | 19.2 | 3.0 | 3.3 |
| Q2 2007 | 22.9 | 2.9 | 3.1 |
| Q3 2007 | 20.9 | 2.4 | 3.2 |
| Q4 2007 | 20.3 | 4.3 | 3.9 |
| Q1 2008 | 13.4 | 3.2 | 3.6 |
| Q2 2008 | 8.9 | 1.5 | 3.3 |
| Q3 2008 | 3.6 | 0.1 | 3.3 |
| Q4 2008 | -5.8 | -9.7 | 4.1 |
| Q1 2009 | -6.3 | -12.9 | 3.9 |
| Q2 2009 | -4.0 | -12.0 | 3.6 |
| Q3 2009 | 3.3 | -8.9 | 3.8 |
| Q4 2009 | 16.2 | 1.0 | 4.7 |
| Q1 2010 | 16.2 | 5.8 | 4.2 |
| Q2 2010 | 17.8 | 6.2 | 4.0 |
| Q3 2010 | 16.8 | 4.4 | 4.2 |
| Q4 2010 | 19.0 | 6.6 | 5.3 |
| Q1 2011 | 19.3 | 7.8 | 4.7 |
| Q2 2011 | 17.8 | 7.7 | 4.4 |
| Q3 2011 | 14.9 | 8.1 | 4.5 |
| Q4 2011 | 18.3 | 6.6 | 5.9 |
| Q1 2012 | 16.9 | 7.6 | 5.1 |
| Q2 2012 | 15.7 | 4.3 | 4.9 |
| Q3 2012 | 16.6 | 4.0 | 5.0 |
| Q4 2012 | 14.5 | 4.0 | 6.5 |
| Q1 2013 | 12.1 | 2.6 | 5.6 |
| Q2 2013 | 13.5 | 4.2 | 5.3 |
| Q3 2013 | 12.7 | 4.9 | 5.4 |
| Q4 2013 | 12.3 | 3.2 | 7.0 |
| Q1 2014 | 12.3 | 2.1 | 6.1 |
| Q2 2014 | 14.9 | 5.0 | 5.8 |
| Q3 2014 | 15.3 | 4.7 | 6.0 |
| Q4 2014 | 13.5 | 4.3 | 7.6 |
| Q1 2015 | 13.8 | 2.2 | 6.8 |
| Q2 2015 | 13.6 | 1.4 | 6.5 |
| Q3 2015 | 13.7 | 2.0 | 6.7 |
| Q4 2015 | 13.3 | 1.7 | 8.5 |
| Q1 2016 | 13.6 | 3.2 | 7.5 |
| Q2 2016 | 14.4 | 2.0 | 7.3 |
| Q3 2016 | 14.0 | 2.0 | 7.4 |
| Q4 2016 | 13.1 | 3.3 | 9.3 |
| Q1 2017 | 14.2 | 3.4 | 8.3 |
| Q2 2017 | 15.7 | 3.9 | 8.1 |
| Q3 2017 | 15.7 | 3.7 | 8.3 |
| Q4 2017 | 16.3 | 4.9 | 10.3 |
| Q1 2018 | 15.8 | 5.0 | 9.1 |
| Q2 2018 | 15.5 | 5.2 | 8.9 |
| Q3 2018 | 14.3 | 4.5 | 9.1 |
| Q4 2018 | 10.1 | 3.5 | 11.0 |
| Q1 2019 | 8.1 | 1.5 | 9.7 |
| Q2 2019 | 10.2 | 3.1 | 9.5 |
| Q3 2019 | 14.6 | 3.9 | 10.0 |
| Q4 2019 | 14.1 | 3.5 | 12.1 |
| Q1 2020 | 20.2 | 2.3 | 11.4 |
| Q2 2020 | 53.9 | -3.3 | 15.2 |
| Q3 2020 | 47.2 | 6.6 | 13.8 |
| Q4 2020 | 42.8 | 6.9 | 16.2 |
| Q1 2021 | 45.7 | 16.2 | 14.3 |
| Q2 2021 | 13.3 | 27.2 | 13.5 |
| Q3 2021 | 9.3 | 12.4 | 13.4 |
| Q4 2021 | 9.0 | 14.0 | 15.5 |
| Q1 2022 | 6.8 | 11.1 | 13.8 |
| Q2 2022 | 4.5 | 8.3 | 13.0 |
| Q3 2022 | 8.5 | 9.1 | 13.4 |
| Q4 2022 | 5.0 | 4.8 | 15.5 |
| Q1 2023 | 8.2 | 2.4 | 14.6 |
| Q2 2023 | 10.6 | -0.9 | 14.5 |
| Q3 2023 | 13.0 | 0.4 | 15.0 |
| Q4 2023 | 13.2 | 0.9 | 17.4 |
| Q1 2024 | 10.6 | 0.6 | 16.0 |
| Q2 2024 | 8.9 | 0.1 | 15.8 |
| Q3 2024 | 8.4 | 0.7 | 16.2 |
| Q4 2024 | 9.1 | 3.4 | 18.4 |
| Q1 2025 | 5.6 | 2.4 | 16.5 |
| Q2 2025 | 6.0 | 3.3 | 16.2 |
| Q3 2025 | 5.5 | 3.8 | 16.5 |
| Q4 2025 | 4.9 | 2.4 | 18.9 |
| Q1 2026 | 8.2 | 3.1 | 17.3 |
| Q2 2026 | 11.6 | 5.7 | 17.1 |
| Q3 2026 | 10.4 | 5.6 | 17.2 |
Download E-commerce share of total US retail sales, quarterly, Q4 1999 to Q3 2026 as CSV · All 11 columns on the dataset page
Methodology
Reading the chart: E-commerce was 17.9% of US retail sales in Q3 2026, the highest seasonally adjusted share in the Census series
- Seasonally adjusted and not adjusted shares are separate Census series; the chart shows one at a time and never puts both on one axis.
- Q3 2026 estimates are preliminary; every quarter comes from the Census release of November 19, 2026, which also revised earlier quarters.
- Census estimates cover retail businesses with paid employees; since the April 2025 annual revision, firms without paid employees are removed from the whole series, so older published figures can differ.
- Online travel services, financial brokers and dealers, and ticket sales agencies are not counted as retail in either total retail or e-commerce sales.
Reading the chart: US e-commerce sales grew 10.4% on a year earlier in Q3 2026, up from 4.9% in Q4 2025
- Growth is computed by Deploi from not seasonally adjusted sales, comparing each quarter with the same quarter a year earlier; total retail growth, computed the same way, is in the data table.
- The not adjusted e-commerce share of retail rose from 16.5% in Q3 2025 to 17.2% in Q3 2026.
- Q3 2026 is preliminary; all quarters come from the Census release of November 19, 2026, which revised earlier quarters.
Caveats: E-commerce share of total US retail sales, quarterly, Q4 1999 to Q3 2026
- Q3 2026 estimates are preliminary. Every quarter comes from the Census release of November 19, 2026, which carries a Notice of Revision, so figures in older releases can differ.
- Seasonally adjusted and not adjusted shares are separate Census series. Compare a seasonally adjusted quarter with the next quarter, and a not adjusted quarter only with the same quarter of another year. The two are never combined in one series.
- Census estimates cover retail businesses with paid employees. Since the April 2025 annual revision, firms without paid employees are removed from the whole series.
- Online travel services, financial brokers and dealers, and ticket sales agencies are not counted as retail in total retail or e-commerce sales.
- Shares are as Census states them, to one decimal place. Growth on a year earlier is computed by Deploi from not seasonally adjusted sales and is empty for the first four quarters, with no year-earlier quarter.
- Census does not adjust for price changes, so growth rates measure dollar sales, not quantities.
- Census counts a sale as e-commerce when the buyer places the order, or the price and terms are negotiated, over the internet, a mobile device, an extranet, an EDI network, email or another comparable online system; payment may or may not be made online.
Deploi's charts and compilation are licensed CC BY 4.0. The underlying facts belong to their sources, which are named on every page. How Deploi Shopify Data works.
Sources
Tier A sources are primary documents: filings, official releases and official price pages. How sources are ranked.
- Tier AQuarterly Retail E-Commerce Sales, 3rd Quarter 2026 release page (CB26-183, 2026-11-19; Notice of Revision)
U.S. Census Bureau · HTML · Read on
- Tier AQuarterly Retail E-Commerce Sales, Adjusted Sales Time Series 4Q 1999 to 3Q 2026 (xlsx converted to CSV text, last revised 2026-11-19)
U.S. Census Bureau · TEXT · Read on
- Tier AQuarterly Retail E-Commerce Sales, Not Adjusted Sales Time Series 4Q 1999 to 3Q 2026 (xlsx converted to CSV text, last revised 2026-11-19)
U.S. Census Bureau · TEXT · Read on
Cite and reuse
Deploi's charts and compilation are licensed CC BY 4.0. The underlying facts belong to their sources, which are named on every page.
APA
Deploi. (2026). What share of US retail sales is ecommerce, quarter by quarter? [Web page]. https://deploi.ca/shopify/data/us-ecommerce-share-of-retail Retrieved November 19, 2026.
BibTeX
@misc{deploi_us_ecommerce_share_of_retail_2026,
  author = {{Deploi}},
  title = {What share of US retail sales is ecommerce, quarter by quarter?},
  year = {2026},
  url = {https://deploi.ca/shopify/data/us-ecommerce-share-of-retail},
  note = {Accessed 2026-11-19}
}
Embed a chart
Embed: E-commerce was 17.9% of US retail sales in Q3 2026, the highest seasonally adjusted share in the Census series
Embed code
<iframe src="https://deploi.ca/embed/shopify/data/us-ecommerce-share-quarterly" title="E-commerce was 17.9% of US retail sales in Q3 2026, the highest seasonally adjusted share in the Census series" loading="lazy" style="width:100%;height:680px;border:0"></iframe>
<p style="font:12px/1.4 Arial,sans-serif;margin:4px 0 0">Source: <a href="https://deploi.ca/shopify/data/charts/us-ecommerce-share-quarterly">Deploi, E-commerce was 17.9% of US retail sales in Q3 2026, the highest seasonally adjusted share in the Census series</a></p>
Embed: US e-commerce sales grew 10.4% on a year earlier in Q3 2026, up from 4.9% in Q4 2025
Embed code
<iframe src="https://deploi.ca/embed/shopify/data/us-ecommerce-growth-vs-retail" title="US e-commerce sales grew 10.4% on a year earlier in Q3 2026, up from 4.9% in Q4 2025" loading="lazy" style="width:100%;height:630px;border:0"></iframe>
<p style="font:12px/1.4 Arial,sans-serif;margin:4px 0 0">Source: <a href="https://deploi.ca/shopify/data/us-ecommerce-share-of-retail#chart-us-ecommerce-growth-vs-retail">Deploi, US e-commerce sales grew 10.4% on a year earlier in Q3 2026, up from 4.9% in Q4 2025</a></p>
Keep the credit line under the embed. It is the license condition.
Downloads
Questions
What share of US retail sales is ecommerce?
Seasonally adjusted, e-commerce was 17.9% of US retail sales in Q3 2026, and 17.2% not adjusted, according to the U.S. Census Bureau's release of November 19, 2026. The Q3 2026 estimate is preliminary. Use the seasonally adjusted figure to compare with the previous quarter.
Is the Q3 2026 ecommerce share final?
No. The U.S. Census Bureau marks the Q3 2026 estimates, including the 17.9% seasonally adjusted share, preliminary. The same release of November 19, 2026 revised earlier quarters, so a figure published in an older release can differ from the one in this dataset.
When did ecommerce first reach 10% of US retail sales?
Seasonally adjusted, the share first passed 10% in Q2 2019, at 10.1%, after 9.9% in Q1 2019, according to the U.S. Census Bureau's quarterly series revised November 19, 2026. Not adjusted, it first passed 10% in Q4 2017, at 10.3%.
Should I use the seasonally adjusted or the not adjusted share?
Use the seasonally adjusted share, 17.9% in Q3 2026, to compare one quarter with the next. Use the not adjusted share, 17.2%, only against the same quarter of another year, as in 16.5% in Q3 2025. Both come from the U.S. Census Bureau's release of November 19, 2026.
Does the share include online travel or ticket sales?
No. The U.S. Census Bureau does not count online travel services, financial brokers and dealers, or ticket sales agencies as retail in either total retail or e-commerce sales, according to its Q3 2026 release of November 19, 2026.
How much did US ecommerce sales grow in Q3 2026?
Not seasonally adjusted, US e-commerce sales grew 10.4% on a year earlier in Q3 2026, against 5.6% for total retail sales, computed by Deploi from the U.S. Census Bureau's estimates released November 19, 2026. Q3 2026 is preliminary.
More on Merchant benchmarks
- How much of US wholesale and manufacturing sales go through ecommerce?
E-commerce was 66.6% of US manufacturing shipments and 35.1% of merchant wholesale sales in 2024, on a Census definition that counts EDI orders. Updated November 19, 2026.
- What are the B2B limits on each Shopify plan?
Seven of the 24 B2B features Shopify marks by plan are not on Basic: 5 are Plus only and 2 are on Advanced and Plus, per Shopify's Help Center read October 18, 2026. Basic, Grow and Advanced allow up to 3 active B2B catalogs. Updated November 19, 2026.
- What do fulfillment warehouse workers earn by Canadian province and in the US?
Alberta has Canada's highest median wage for material handlers, C$24.00 an hour, and Newfoundland and Labrador the lowest, C$19.94, per Job Bank wage data for 2024 to 2025. Updated November 19, 2026.
- What do returns apps cost at 500, 2,000 and 10,000 returns a month?
At 2,000 returns a month Return Prime costs $909 and AfterShip $1,009, while Redo's listing shows a $0 plan fee with per-return charges not stated and Loop publishes no volume price, computed by Deploi from prices read by November 18, 2026. Updated November 19, 2026.
- How have de minimis duty-free thresholds changed in the US, EU, UK and Canada, and what does that mean for cross-border Shopify orders?
The US suspended duty-free de minimis treatment for all countries on August 29, 2025, and the EU ended its EUR 150 duty exemption on June 30, 2026. Updated November 18, 2026.
- What do Shopify's published checkout conversion-lift claims say, and what evidence is behind each?
Shopify's pages claim checkout conversion lifts of 3.5% to 50%, including up to 36% over rivals and 15% on average, and none of its 9 checkout claims states a sample size. Updated November 18, 2026.
Changes
- · E-commerce share of total US retail sales, quarterly, Q4 1999 to Q3 2026
First published.