
What share of their sales do retailers in each Canadian province make online?
Manitoba retailers made an average of 12.6% of their sales online in 2024, the most of any province, against 7.3% for Canada, but a different province has led each year since 2021. Updated November 18, 2026.
By Martin DejnickiUpdated Data through 2024
Short answer
Retailers in Manitoba made an average of 12.6% of their sales online in 2024, the highest of any province, against 7.3% for Canada, according to Statistics Canada's business surveys. British Columbia followed at 11.0%. A different province led in each year from 2021 to 2024, and Statistics Canada grades Manitoba's 2024 value C.
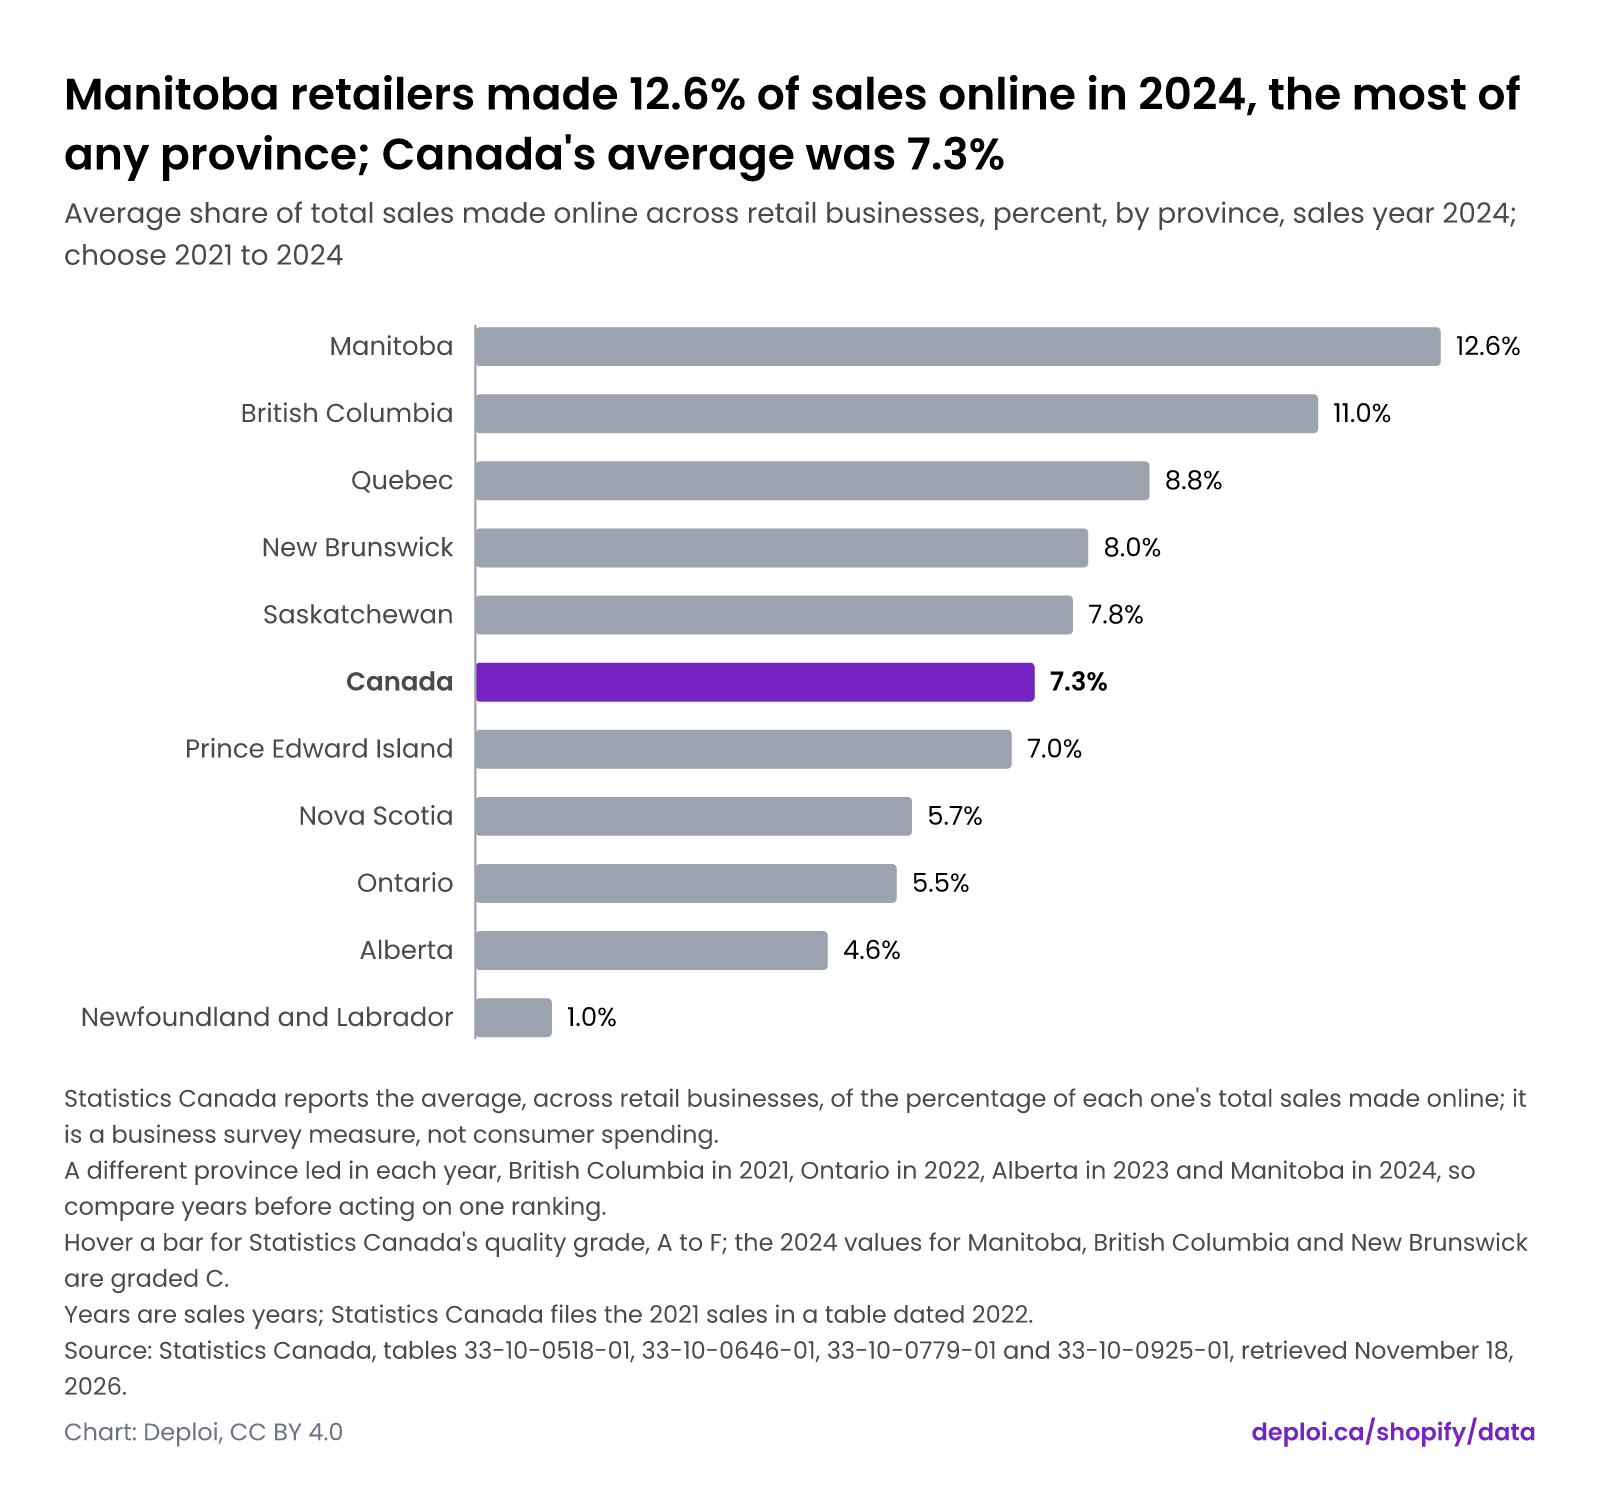
Manitoba retailers made 12.6% of sales online in 2024, the most of any province; Canada's average was 7.3%
Average share of total sales made online across retail businesses, percent, by province, sales year 2024; choose 2021 to 2024
Average share of retail sales made online, by province, 2024
Canada's average share of retail sales made online, by sales year
- 2024
- 7.3%In 2024, Manitoba retailers made 12.6% of their sales online on average, the most of any province, against 7.3% for Canada; Newfoundland and Labrador was lowest at 1.0%.
- 2023
- 5.9%In 2023, Alberta retailers led at 11.0% of sales online on average and Nova Scotia followed at 10.9%, against 5.9% for Canada; Prince Edward Island was lowest at 0.9%.
- 2022
- 7.3%In 2022, Ontario retailers led at 10.7% of sales online on average, against 7.3% for Canada; Saskatchewan was lowest at 3.0%.
- 2021
- 10.9%In 2021, British Columbia retailers led at 14.8% of sales online on average, against 10.9% for Canada; Nova Scotia was lowest at 1.9%.
- Statistics Canada reports the average, across retail businesses, of the percentage of each one's total sales made online; it is a business survey measure, not consumer spending.
- A different province led in each year, British Columbia in 2021, Ontario in 2022, Alberta in 2023 and Manitoba in 2024, so compare years before acting on one ranking.
- Hover a bar for Statistics Canada's quality grade, A to F; the 2024 values for Manitoba, British Columbia and New Brunswick are graded C.
- Years are sales years; Statistics Canada files the 2021 sales in a table dated 2022.
Source: Statistics Canada, tables 33-10-0518-01, 33-10-0646-01, 33-10-0779-01 and 33-10-0925-01, retrieved November 18, 2026. Read on .
What this means for your decision
- Choosing provinces for local delivery promises? Do not rank provinces by this table. Statistics Canada's figure averages, across retail businesses in each province, the share of each one's own sales made online. It does not say where online shoppers live or how much they spend. Manitoba's 12.6% in 2024 describes Manitoba retailers, not Manitoba buyers, so set delivery promises from your own orders by province.
- Deciding on Quebec French content? Quebec retailers made an average of 8.8% of their sales online in 2024, 1.5 points above Canada's 7.3%. Quebec was above the national average in 2023 too, and below it in 2021 and 2022. The measure covers how much Quebec-based retailers sell online, not their customers' language, so it neither supports nor rules out French content.
- Judging how mature online selling is in a province? Read all four sales years, 2021 to 2024, before ranking. A different province led each year, and Ontario, the 2022 leader at 10.7%, fell to 3.0% in 2023. Canada's own average ranged from 5.9% in 2023 to 10.9% in 2021.
- Citing one province's figure? Quote its sales year and quality grade with it. Statistics Canada grades the 2024 values for Manitoba, British Columbia and New Brunswick C, below Canada's A, and Manitoba's 12.6% follows 2.4% in 2023, a 10.2-point jump computed by Deploi.
- Sizing the online market in dollars? This table cannot do it. It averages each retailer's online share, so it is not the share of retail dollars sold online, and the provincial values do not add up to a national total.
Which province's retailers make the largest share of their sales online?
Retailers in Manitoba made an average of 12.6% of their sales online in 2024, ahead of British Columbia at 11.0% and Quebec at 8.8%, according to Statistics Canada table 33-10-0925-01. Canada's average was 7.3%, and Newfoundland and Labrador was lowest at 1.0%. The chart lets you switch the sales year from 2021 to 2024.
The measure is the average, across retail businesses, of the percentage of each business's total sales made online. It is a business survey measure, not consumer spending and not the share of retail dollars sold online. The province is where the businesses are; the tables do not say where their customers live.
The other 2024 averages were New Brunswick 8.0%, Saskatchewan 7.8%, Prince Edward Island 7.0%, Nova Scotia 5.7%, Ontario 5.5% and Alberta 4.6%.
Does the leading province change from year to year?
Yes. A different province led in each sales year: British Columbia at 14.8% in 2021, Ontario at 10.7% in 2022, Alberta at 11.0% in 2023 and Manitoba at 12.6% in 2024, according to Statistics Canada tables 33-10-0518-01, 33-10-0646-01, 33-10-0779-01 and 33-10-0925-01. Canada's average was 10.9%, 7.3%, 5.9% and 7.3% in those years.
British Columbia and Alberta each ranked among the three highest provinces in three of the four years, computed by Deploi from the table.
Years are sales years. Statistics Canada files the 2021 sales in a table dated 2022, and the dataset records the sales year.
How reliable are the provincial averages?
Provincial averages swing by several points from year to year and carry Statistics Canada quality grades on a scale from A to F. Manitoba's average rose from 2.4% in 2023 to 12.6% in 2024, a 10.2-point change computed by Deploi, and the 2024 values for Manitoba, British Columbia and New Brunswick are graded C, a lower grade than Canada's A.
Other provinces also swung by several points. Ontario went from 10.7% in 2022 to 3.0% in 2023, and Alberta from 11.0% in 2023 to 4.6% in 2024, according to Statistics Canada.
Hover a bar in the chart for each value's quality grade. A province's rank in one year is a weak basis for a decision; compare years before acting on one ranking.
How does Quebec compare with the rest of Canada?
Quebec retailers made 8.8% of their sales online in 2024, 1.5 points above Canada's 7.3%, according to Statistics Canada table 33-10-0925-01, graded B. Quebec was below the Canadian average in 2021 (8.8% against 10.9%) and 2022 (5.1% against 7.3%), and above it in 2023 (7.0% against 5.9%).
The series shows no steady gap in either direction: Quebec's average was 8.8% in both 2021 and 2024.
This measure covers how much of a retailer's sales happen online, not who the customers are or what language they use.
Does this show how many retailers sell online?
No. The dataset holds only the average share of total sales made online by retail businesses in each province, for sales years 2021 to 2024 from Statistics Canada. The percentage of retailers that sell online is not in the dataset, and the 2020 table is listed without values.
The share of retailers selling online and the share of sales made online answer different questions. A province can have many retailers with a small online share, or few with a large one.
The data table keeps a column for retailers selling online. It is empty. Statistics Canada's tables give the spread of retailers across bands of online sales share, and the average. The 0% band is the share with no online sales, 71.9% of Canadian retail businesses in 2024 (graded B, table 33-10-0925-01). The tables state no share selling online, and Deploi has not derived one from the 0% band.
What should a Canadian merchant take from the provincial ranking?
Use the provincial ranking as a rough guide to how much each province's retailers sell online, and not as a ranking to act on from one year alone. In Statistics Canada's four sales years from 2021 to 2024 a different province led each year, and Canada's own average ranged from 5.9% in 2023 to 10.9% in 2021.
Look at several years and at the quality grade before drawing a conclusion for a province. For Canadian shipping context, see how far Canada Post parcel volumes fell in the labour disruption.
The figures describe retailers' sales, not how any one store will perform in a province.
The data
Each chart on this page is drawn from the numbers below. Units are in the column headers.
Methodology
Reading the chart: Manitoba retailers made 12.6% of sales online in 2024, the most of any province; Canada's average was 7.3%
- Statistics Canada reports the average, across retail businesses, of the percentage of each one's total sales made online; it is a business survey measure, not consumer spending.
- A different province led in each year, British Columbia in 2021, Ontario in 2022, Alberta in 2023 and Manitoba in 2024, so compare years before acting on one ranking.
- Hover a bar for Statistics Canada's quality grade, A to F; the 2024 values for Manitoba, British Columbia and New Brunswick are graded C.
- Years are sales years; Statistics Canada files the 2021 sales in a table dated 2022.
Caveats: Average share of retail sales made online by province, Canada, sales years 2021 to 2024
- This is a business survey measure: the average across retail businesses of each one's share of sales made online. It is not consumer spending and not the share of retail dollars sold online.
- Statistics Canada grades each value from A to F. The 2024 values for Manitoba, British Columbia and New Brunswick are graded C, and several other values carry grade B or C. Provincial values swing by several points between years, so one year's ranking is a weak basis for a decision.
- Years are sales years. Statistics Canada files the 2021 sales in a table dated 2022, and the dataset records the sales year.
- The tables read give the share of retailers with no online sales (the 0% band): 71.9% of Canadian retail businesses in 2024 (Retail trade [44-45], table 33-10-0925-01). Deploi has not derived the complement, so the share of retailers that sell online is empty here. The 2020 rows are listed without values.
Deploi's charts and compilation are licensed CC BY 4.0. The underlying facts belong to their sources, which are named on every page. How Deploi Shopify Data works.
Sources
Tier A sources are primary documents: filings, official releases and official price pages. How sources are ranked.
- Tier A
- Tier A
- Tier A
- Tier ATable 33-10-0779-01 Percentage and average percentage of total sales made online in 2023 (full-table CSV; released 2024-02-26)
Statistics Canada · TEXT · Read on
- Tier ATable 33-10-0925-01 Percentage and average percentage of total sales made online in 2024 (full-table CSV; released 2025-02-28)
Statistics Canada · TEXT · Read on
Cite and reuse
Deploi's charts and compilation are licensed CC BY 4.0. The underlying facts belong to their sources, which are named on every page.
APA
Deploi. (2026). What share of their sales do retailers in each Canadian province make online? [Web page]. https://deploi.ca/shopify/data/canada-online-sales-share-by-province Retrieved November 18, 2026.
BibTeX
@misc{deploi_canada_online_sales_share_by_province_2026,
  author = {{Deploi}},
  title = {What share of their sales do retailers in each Canadian province make online?},
  year = {2026},
  url = {https://deploi.ca/shopify/data/canada-online-sales-share-by-province},
  note = {Accessed 2026-11-18}
}
Embed this chart
Embed code
<iframe src="https://deploi.ca/embed/shopify/data/canada-online-sales-share-by-province" title="Manitoba retailers made 12.6% of sales online in 2024, the most of any province; Canada's average was 7.3%" loading="lazy" style="width:100%;height:720px;border:0"></iframe> <p style="font:12px/1.4 Arial,sans-serif;margin:4px 0 0">Source: <a href="https://deploi.ca/shopify/data/canada-online-sales-share-by-province#chart-canada-online-sales-share-by-province">Deploi, Manitoba retailers made 12.6% of sales online in 2024, the most of any province; Canada's average was 7.3%</a></p>
Keep the credit line under the embed. It is the license condition.
Questions
Which province's retailers make the largest share of their sales online?
In 2024, Manitoba retailers made an average of 12.6% of their sales online, the most of any province, according to Statistics Canada table 33-10-0925-01. British Columbia followed at 11.0%. Canada's average was 7.3%, and a different province led in each of 2021, 2022 and 2023.
What share of their sales do Quebec retailers make online?
Quebec retailers made an average of 8.8% of their sales online in 2024, against 7.3% for Canada, per Statistics Canada table 33-10-0925-01. The same measure was 5.1% in 2022 and 7.0% in 2023. Quebec's 2024 value is graded B.
Is the Manitoba figure reliable?
Treat it with care. Statistics Canada grades Manitoba's 2024 average of 12.6% as C, and the value rose from 2.4% in 2023, a 10.2-point change computed by Deploi. The grade scale runs from A to F, and Canada's own 2024 value is graded A.
Is this the share of retailers that sell online?
No. It is the average, across retail businesses in a province, of the percentage of each business's total sales made online, from Statistics Canada's business surveys. The share of retailers that sell online is not in this dataset.
Which years does the data cover?
Sales years 2021 to 2024, from Statistics Canada tables 33-10-0518-01, 33-10-0646-01, 33-10-0779-01 and 33-10-0925-01, retrieved November 18, 2026. The 2020 table is listed in the dataset without values. Statistics Canada files the 2021 sales in a table dated 2022.
More on Canada
- Is Canada's online share of retail really less than half the US share?
Computed by Deploi from each agency's series, Canada's online share of retail was 7.0% in 2025 against 17.0% for the US, but the agencies define retail e-commerce differently. Updated November 19, 2026.
- How far did Canada Post parcel volumes fall in the labour disruption, and have they recovered?
Canada Post carried 48 million parcels in Q2 2026, up 15.6% on a year earlier but below the 66 million of Q2 2024. Updated November 18, 2026.
- How much has Canada Post raised parcel rates each year, by service segment?
Canada Post's 2025 domestic parcel increase was just under 1%, after 3.4% to 4% a year from 2020 to 2023, according to its rate-action notices read November 18, 2026. Updated November 18, 2026.
- At what value do duties and taxes apply to a parcel shipped into Canada, by origin country?
Courier parcels from the US or Mexico enter Canada free of duty and tax up to C$40, and parcels from other origins up to C$20, according to the Canada Border Services Agency. Updated October 18, 2026.
- How big is Canadian retail ecommerce, and what share of retail sales is online?
Retail ecommerce was 7.0% of Canada's retail sales in 2025, or C$59.2 billion, according to Statistics Canada's monthly retail trade data released September 24, 2026. Updated October 18, 2026.
- How large is the Quebec market compared with the rest of Canada, and does it justify a French storefront?
Quebec accounted for 22.2% of Canada's retail sales in 2025, second to Ontario, according to Statistics Canada, and 74.8% of its residents had French as their only mother tongue in the 2021 Census. Updated October 18, 2026.
Changes
- · Average share of retail sales made online by province, Canada, sales years 2021 to 2024
First published.