
Shopify statistics, every number traced
Shopify's gross merchandise volume reached $378.4 billion in fiscal 2025 and its revenue $11.56 billion. Every number below links to its source: Shopify's filings, releases and price pages, or open measurement. Updated October 13, 2026.
By Martin DejnickiUpdated Data through October 13, 2026
Short answer
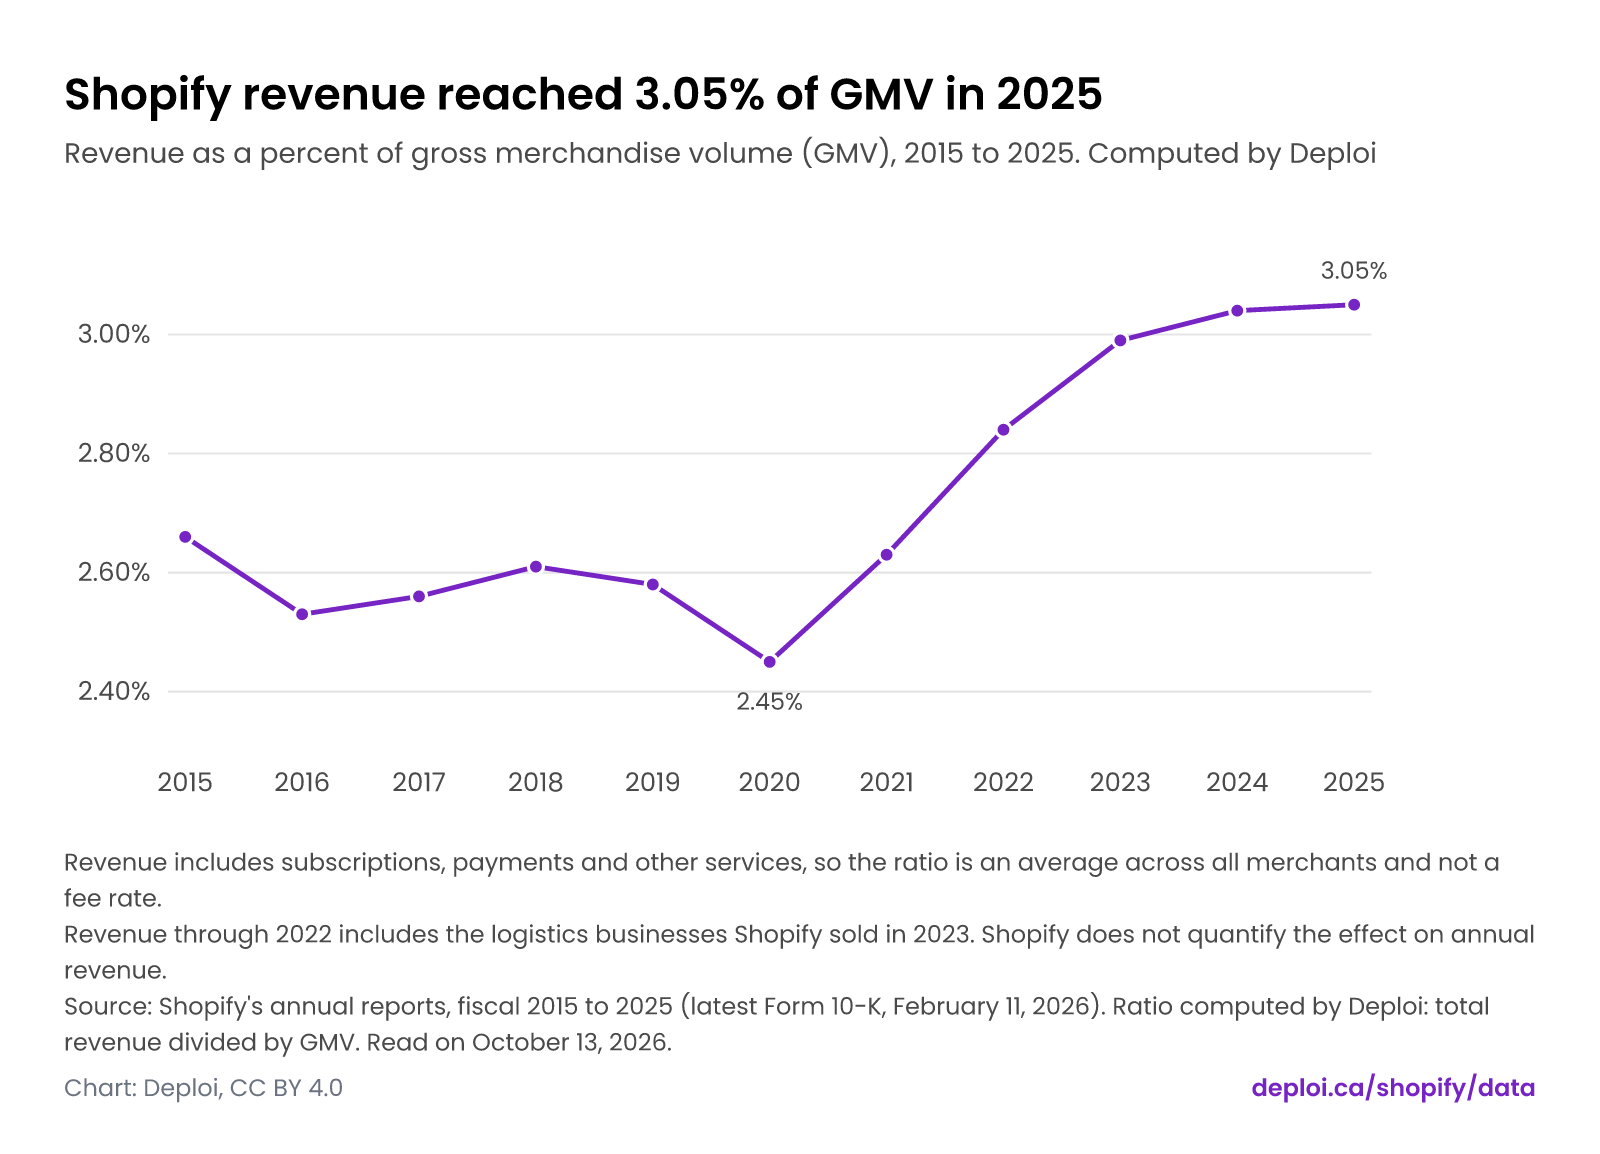
Gross merchandise volume on Shopify reached $378.4 billion in fiscal 2025, up 29%, and Shopify earned $11.56 billion of revenue, 3.05% of that volume. Black Friday-Cyber Monday 2025 sales were $14.6 billion. Shopify's last published merchant count is 2,063,000, for year-end 2021. Each figure below links to its source.
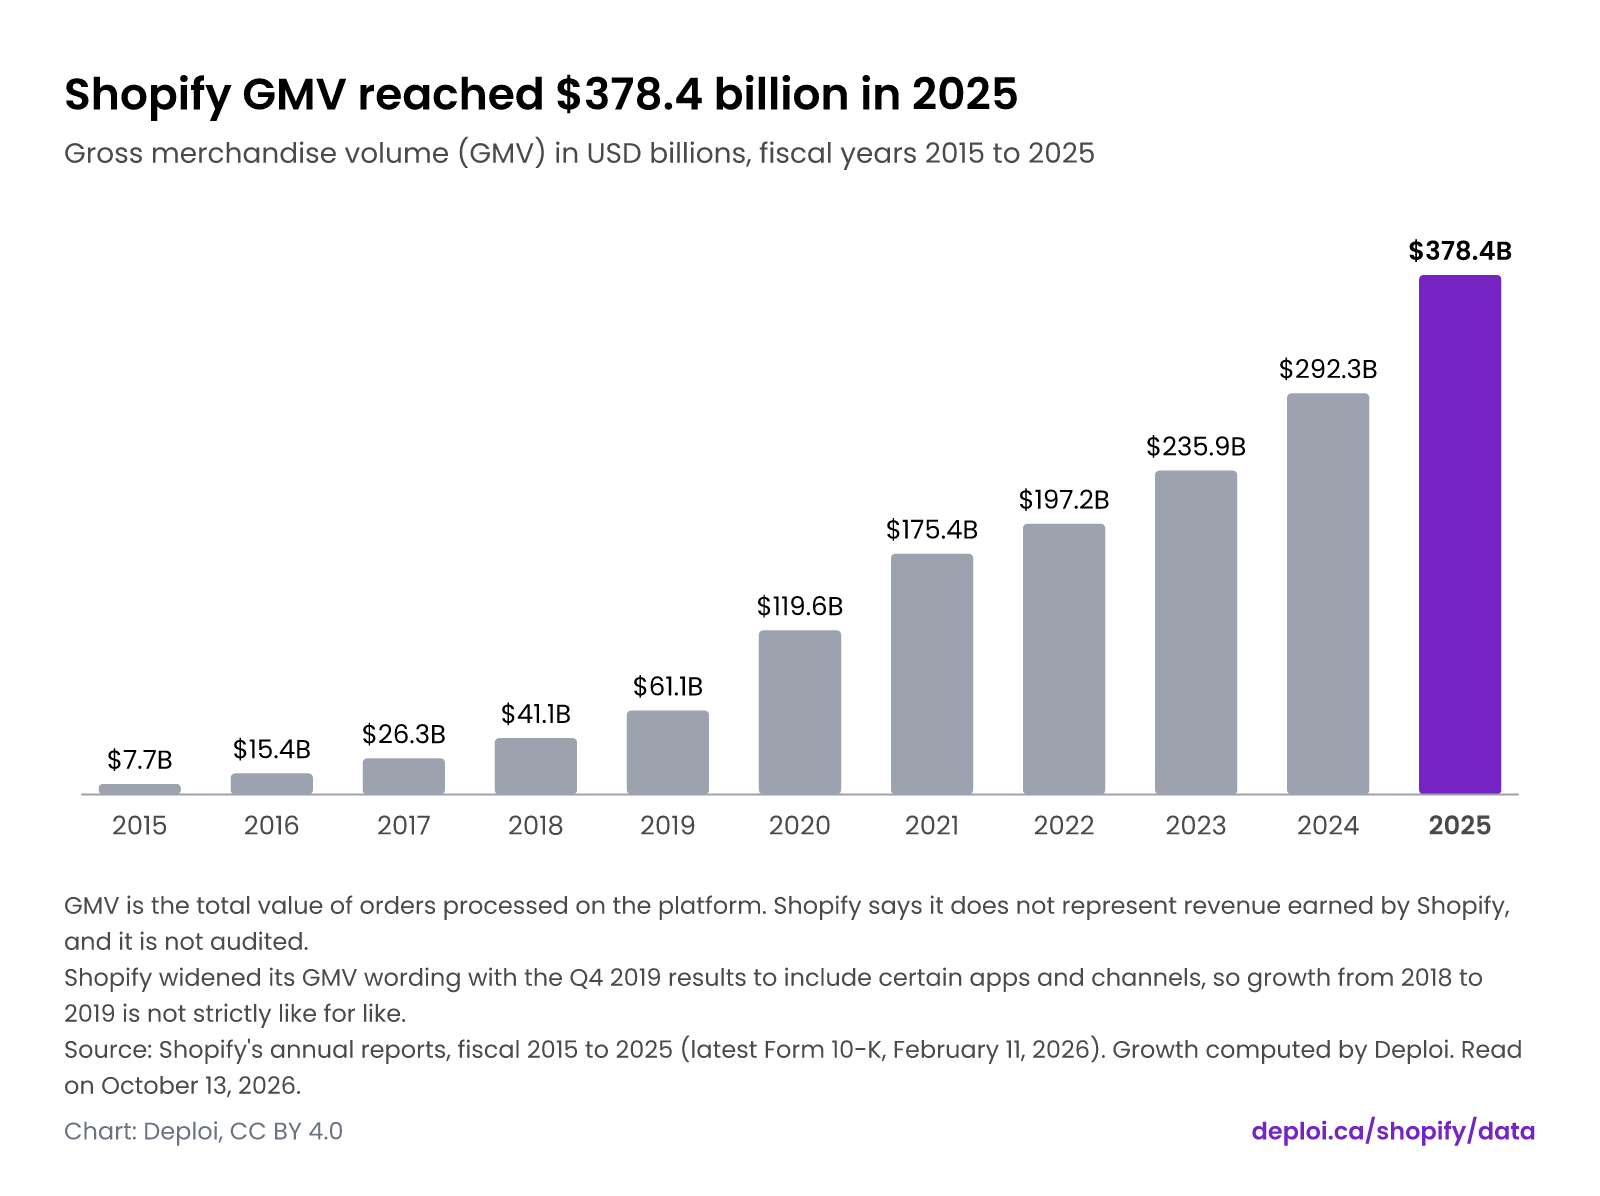
Shopify GMV reached $378.4 billion in 2025
Gross merchandise volume (GMV) in USD billions, fiscal years 2015 to 2025
- GMV is the total value of orders processed on the platform. Shopify says it does not represent revenue earned by Shopify, and it is not audited.
- Shopify widened its GMV wording with the Q4 2019 results to include certain apps and channels, so growth from 2018 to 2019 is not strictly like for like.
Source: Shopify's annual reports, fiscal 2015 to 2025 (latest Form 10-K, February 11, 2026). Growth computed by Deploi. Read on .
What this means for your decision
- Sizing the platform? GMV is the platform's total order value, not its revenue and not your market. Use it to judge scale and growth: $378.4 billion in fiscal 2025, up 29%.
- Choosing a plan? The Plus break-even is $800,400 a month in US online sales on list prices. Add the apps, taxes and fees that apply to you before you decide.
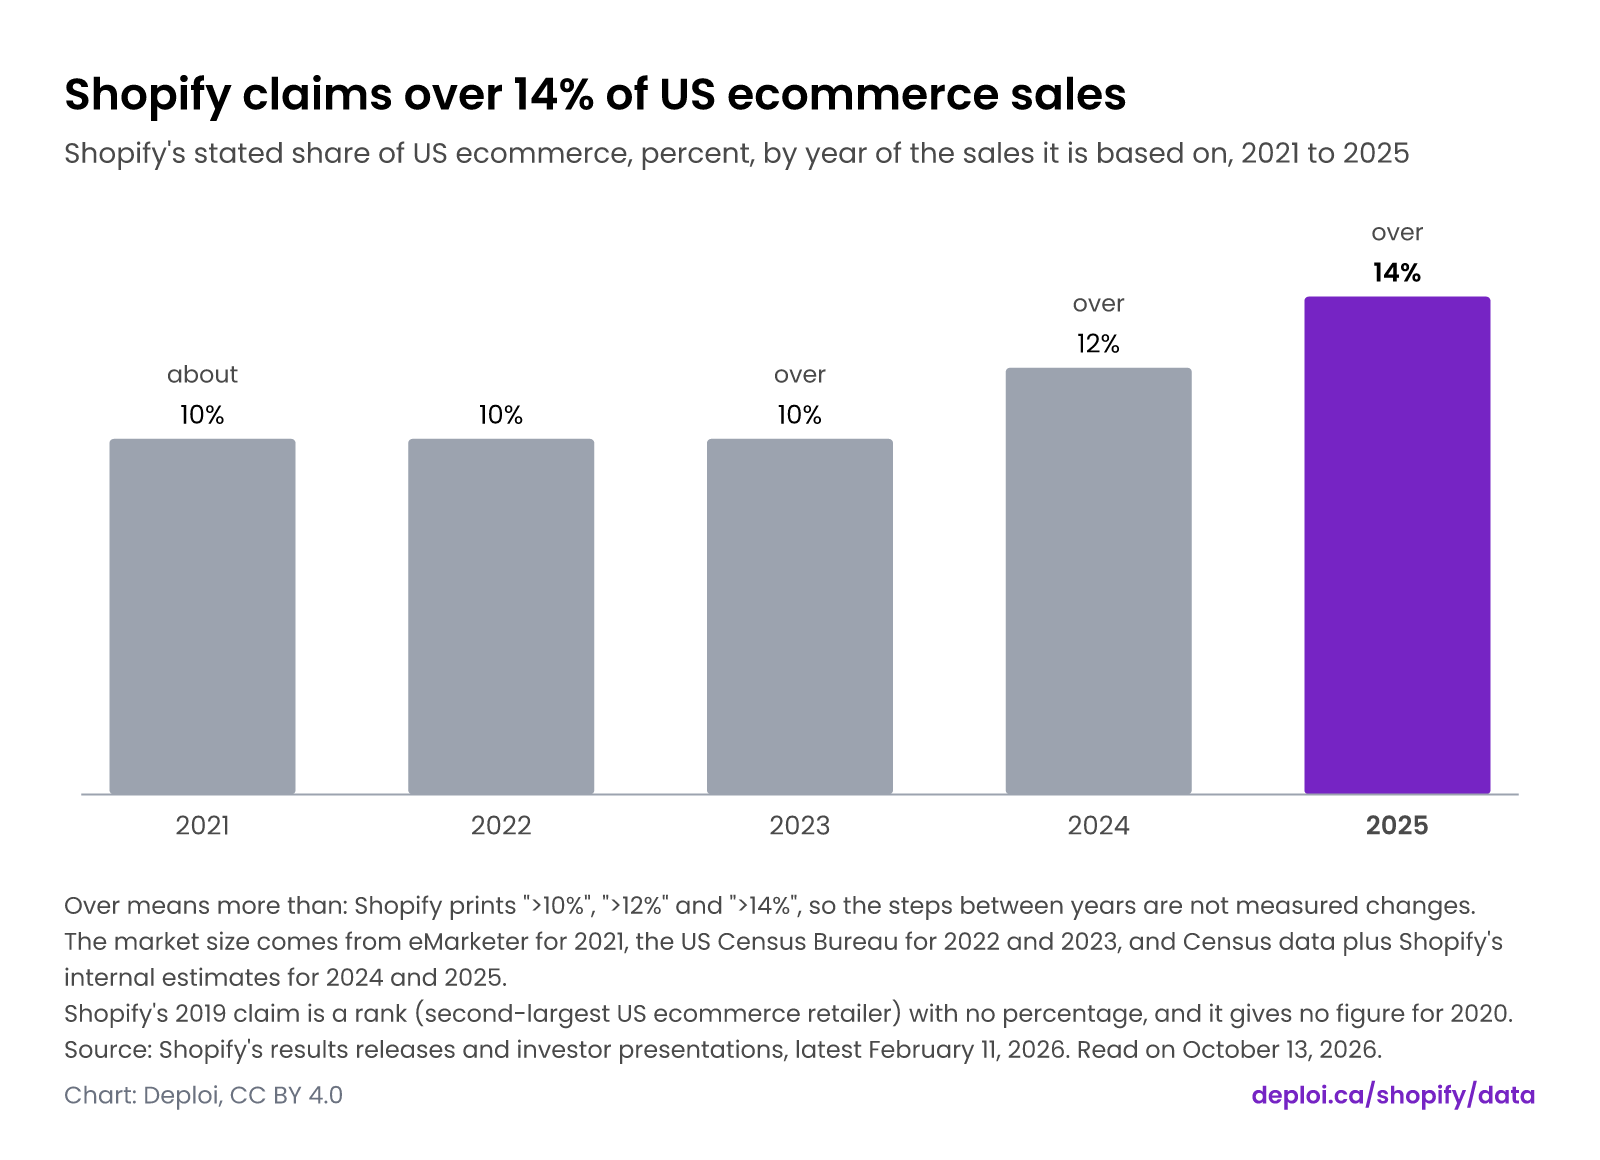
- Quoting a Shopify number? Use the figure Shopify states and keep its qualifier. "Over 14% of US ecommerce" is a lower bound, and the last merchant count is from 2021.
- Planning a Shopify build or migration? Deploi builds ecommerce sites. Contact Deploi before you commit to a plan.
How big is Shopify's gross merchandise volume?
Shopify's gross merchandise volume (GMV) reached $378.4 billion in fiscal 2025, up 29% from $292.3 billion in 2024, according to its Form 10-K filed February 11, 2026. GMV has grown every year since $7.7 billion in 2015. GMV is the value of orders on the platform, not Shopify's revenue.
GMV counts what shoppers paid merchants on Shopify, including shipping, duties and taxes. It measures the platform's scale, not Shopify's income. Growth slowed from 96% in 2020 to 12% in 2022, then recovered to 29% in 2025.
How much do Shopify merchants sell over Black Friday-Cyber Monday?
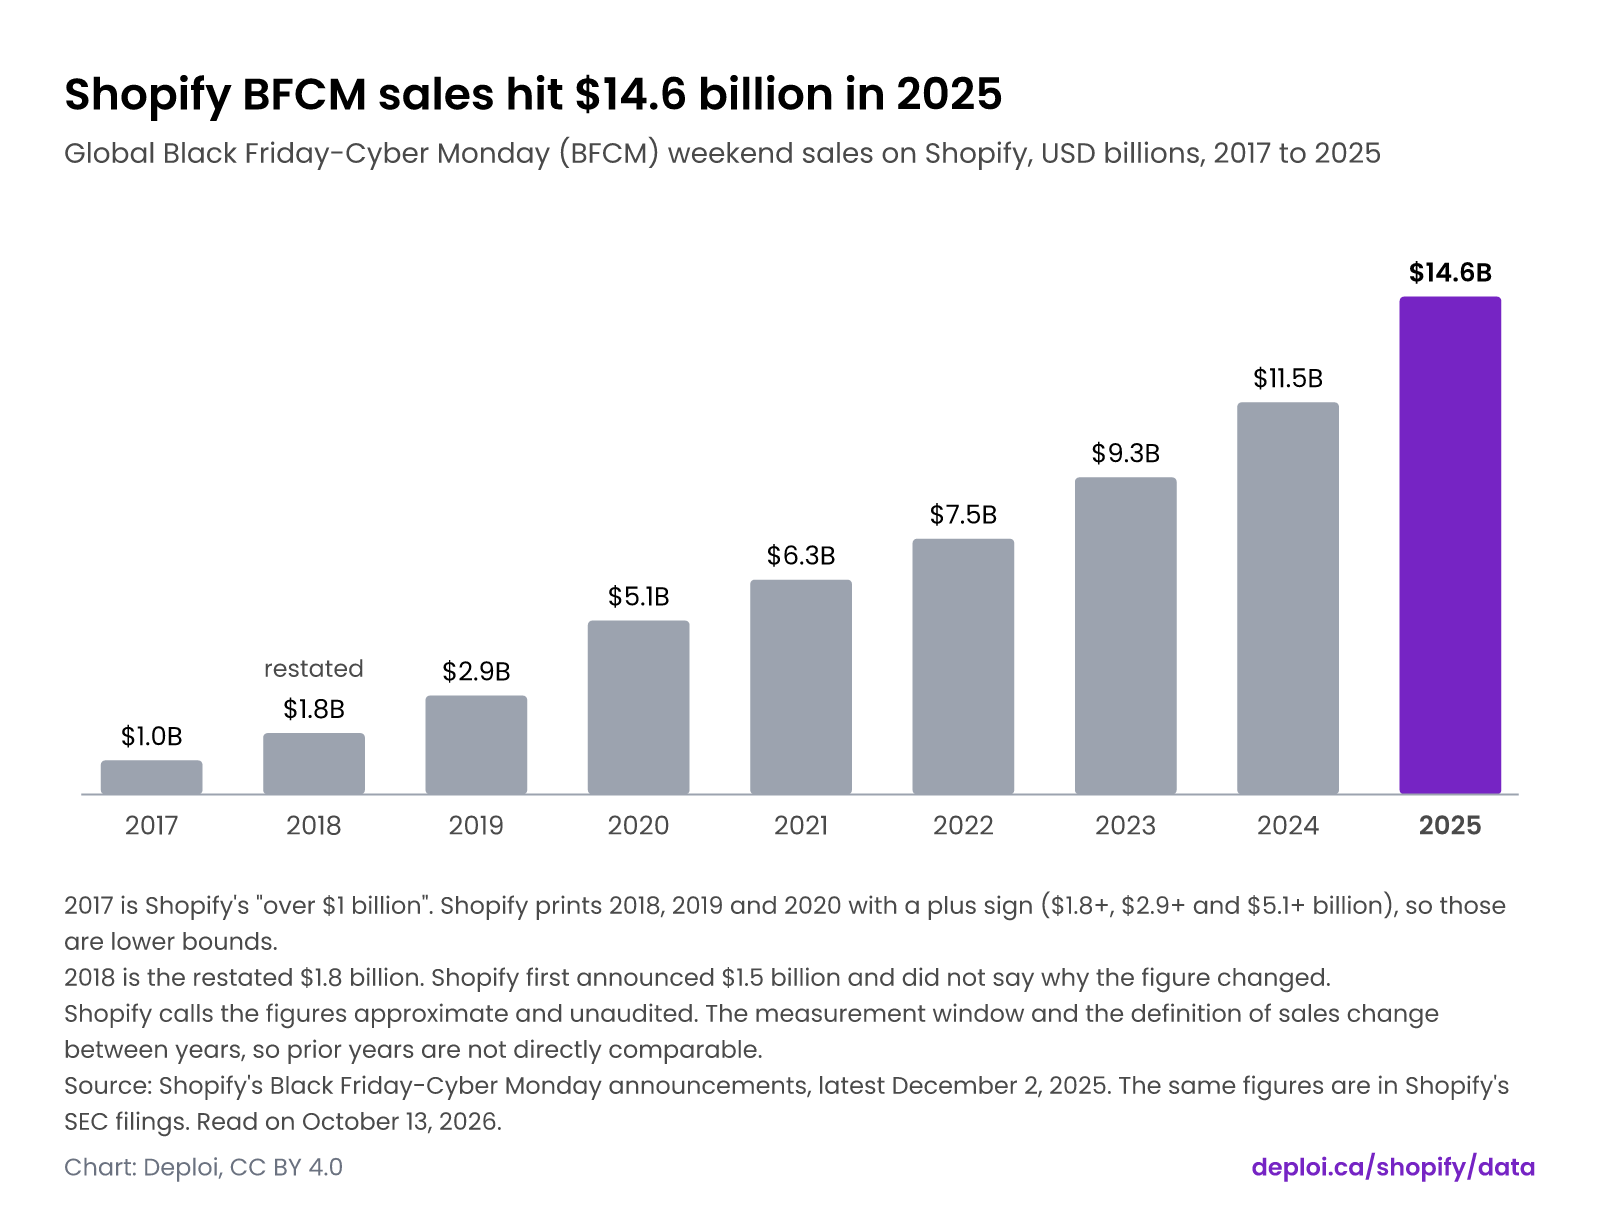
Shopify merchants sold $14.6 billion worldwide over Black Friday-Cyber Monday weekend 2025, up 27% from $11.5 billion in 2024, according to Shopify's announcement of December 2, 2025. Sales have risen every year since the $1 billion reported for 2017. Shopify calls the figures approximate and unaudited.
Shopify announces one global total after each weekend. Each year uses its own measurement window, so read the series as a trend, not to the dollar. Shopify also reports buyers: 81+ million in 2025 and 76+ million in 2024. The 2025 count is based on unique buyer emails and is not like for like with earlier years. The 2018 total was restated from $1.5 billion to $1.8 billion.
Shopify BFCM sales hit $14.6 billion in 2025
Global Black Friday-Cyber Monday (BFCM) weekend sales on Shopify, USD billions, 2017 to 2025
- 2017 is Shopify's "over $1 billion". Shopify prints 2018, 2019 and 2020 with a plus sign ($1.8+, $2.9+ and $5.1+ billion), so those are lower bounds.
- 2018 is the restated $1.8 billion. Shopify first announced $1.5 billion and did not say why the figure changed.
- Shopify calls the figures approximate and unaudited. The measurement window and the definition of sales change between years, so prior years are not directly comparable.
Source: Shopify's Black Friday-Cyber Monday announcements, latest December 2, 2025. The same figures are in Shopify's SEC filings. Read on .
How much of Shopify's GMV runs through Shopify Payments?
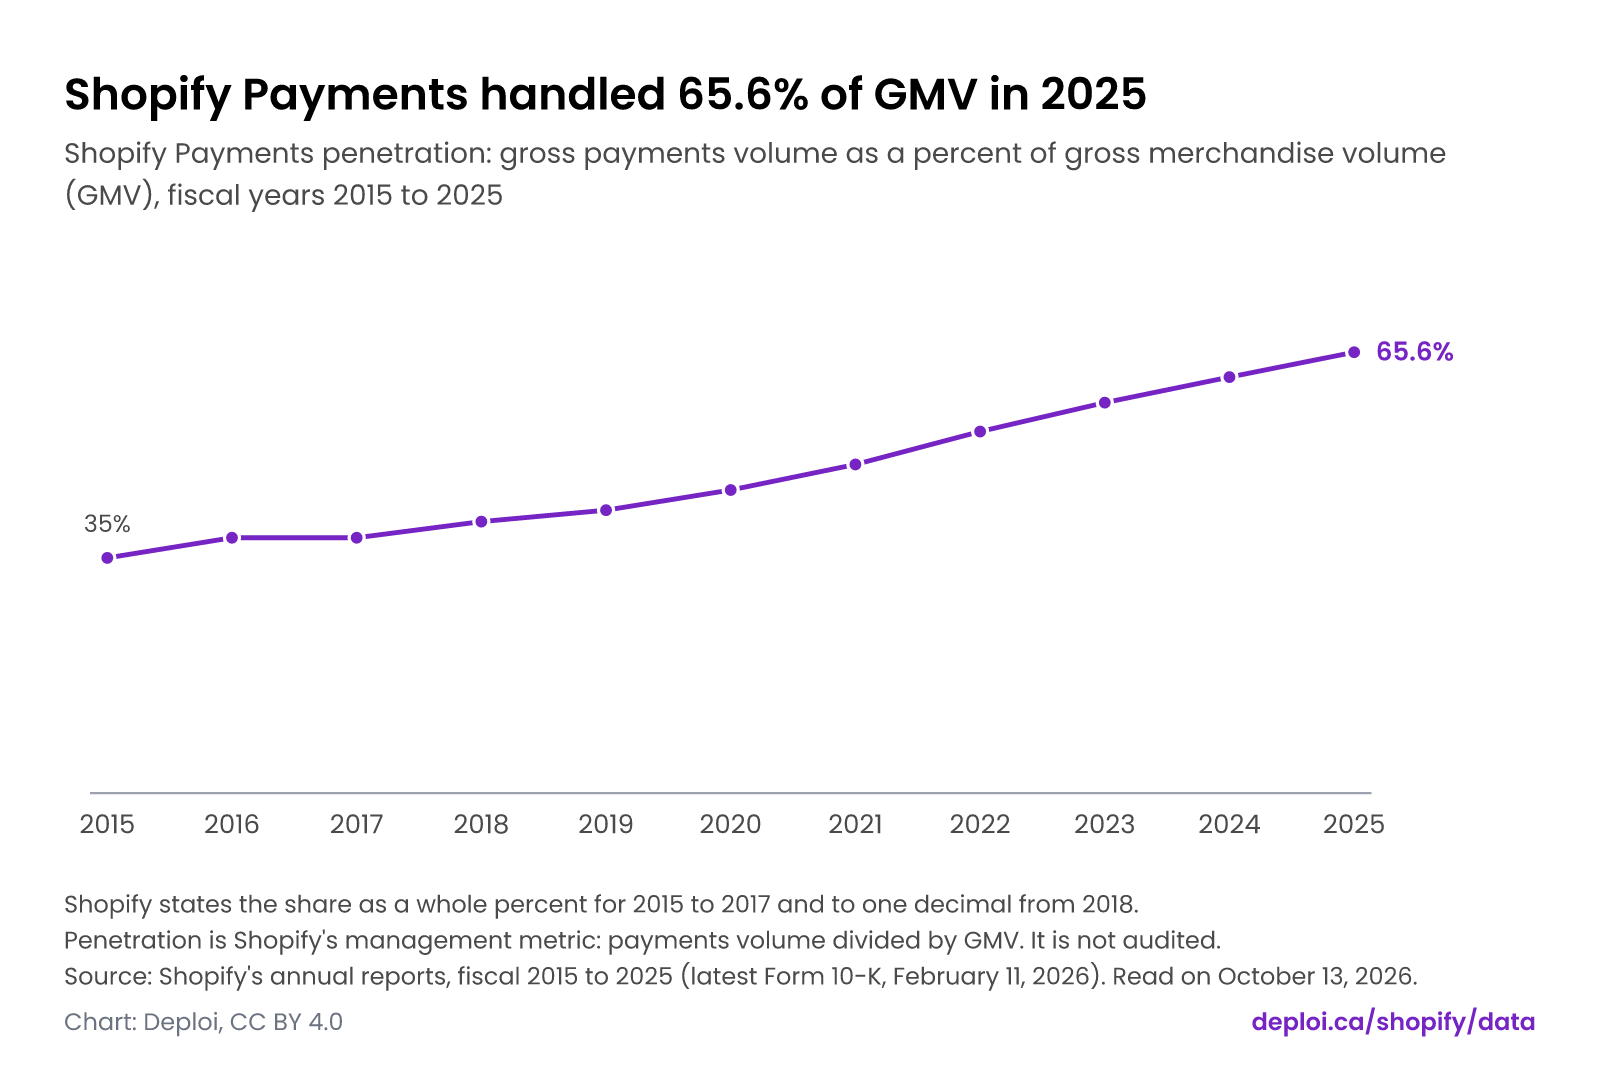
Shopify Payments processed $248.1 billion, or 65.6%, of Shopify's GMV in fiscal 2025, according to its Form 10-K filed February 11, 2026. The share was 35% in 2015 and has risen every year since 2017. Shopify calls the share its penetration rate.
Merchant Solutions, the revenue line that includes payments, was $8,804 million of Shopify's $11,556 million revenue in 2025. Subscription Solutions was $2,752 million. Merchants who use another payment provider pay Shopify a third-party transaction fee on those sales. On the US price list the fee is 2% on Basic, 1% on Grow, 0.6% on Advanced and 0.2% on Plus.
Shopify Payments handled 65.6% of GMV in 2025
Shopify Payments penetration: gross payments volume as a percent of gross merchandise volume (GMV), fiscal years 2015 to 2025
- Shopify states the share as a whole percent for 2015 to 2017 and to one decimal from 2018.
- Penetration is Shopify's management metric: payments volume divided by GMV. It is not audited.
Source: Shopify's annual reports, fiscal 2015 to 2025 (latest Form 10-K, February 11, 2026). Read on .
Where does Shopify's revenue come from?
The United States produced 63% of Shopify's $11.6 billion revenue in fiscal 2025 ($7,331 million) from 44% of its merchants, according to its Form 10-K. EMEA produced 21% of revenue from 31% of merchants, APAC 10% from 16%, Canada 5% from 5%, and Latin America 1% from 5%.
Shopify assigns revenue by where the merchant is located, not where the buyer is. The US share of revenue has slipped from 67% in 2022 to 63% in 2025. From 2026 Shopify reports Europe and Rest of World in place of EMEA and Latin America.
The US has 44% of Shopify's merchants but 63% of its revenue
Share of merchants and share of revenue by merchant location, percent, fiscal year 2025
- Region is where the merchant is located, not where the buyer is. EMEA (usually Europe, the Middle East and Africa) and APAC (usually Asia-Pacific) are Shopify's labels, and the Form 10-K does not define them.
- Revenue shares are the whole percents Shopify prints, and they add to 100. Merchant shares add to 101 because of rounding. Canada is 5% on both measures, so its two dots overlap.
- The United States produced $7,331 million of $11,556 million. Shopify no longer gives a merchant count, so merchant shares cannot be turned into counts.
Source: Shopify Form 10-K for fiscal 2025, filed February 11, 2026. Merchant locations are at December 31, 2025, and revenue is by merchant location. Read on .

How many merchants does Shopify have?
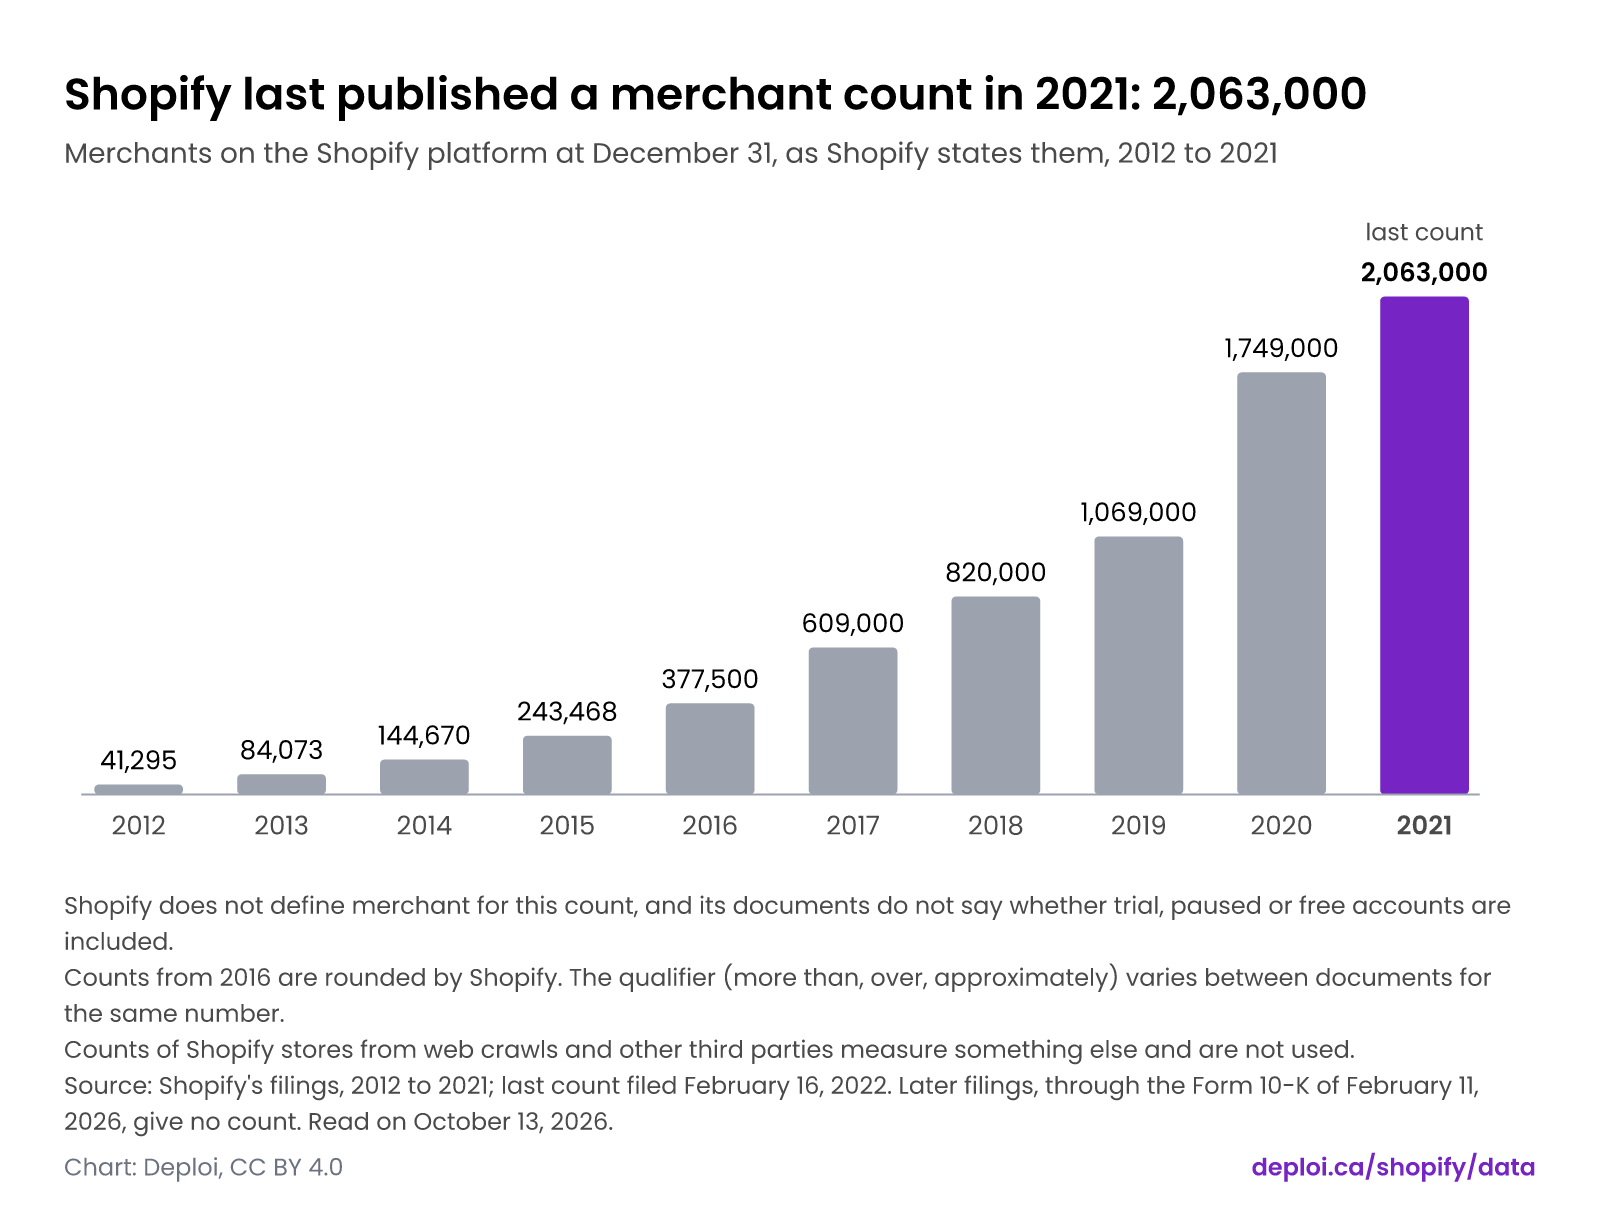
Shopify last published a merchant count for year-end 2021: approximately 2,063,000 merchants, in its annual information form filed February 16, 2022. Since then Shopify says only "millions of merchants", including in its Form 10-K for 2025. In August 2025 Shopify told the SEC that the number of paying merchants has become less relevant to understanding its business.
Shopify does not define merchant for this count. Any later figure for "Shopify merchants" or "Shopify stores" comes from outside Shopify's filings, usually from counting websites, and is not in this dataset.
Shopify last published a merchant count in 2021: 2,063,000
Merchants on the Shopify platform at December 31, as Shopify states them, 2012 to 2021
- Shopify does not define merchant for this count, and its documents do not say whether trial, paused or free accounts are included.
- Counts from 2016 are rounded by Shopify. The qualifier (more than, over, approximately) varies between documents for the same number.
- Counts of Shopify stores from web crawls and other third parties measure something else and are not used.
Source: Shopify's filings, 2012 to 2021; last count filed February 16, 2022. Later filings, through the Form 10-K of February 11, 2026, give no count. Read on .
How common is Shopify among the most visited sites?
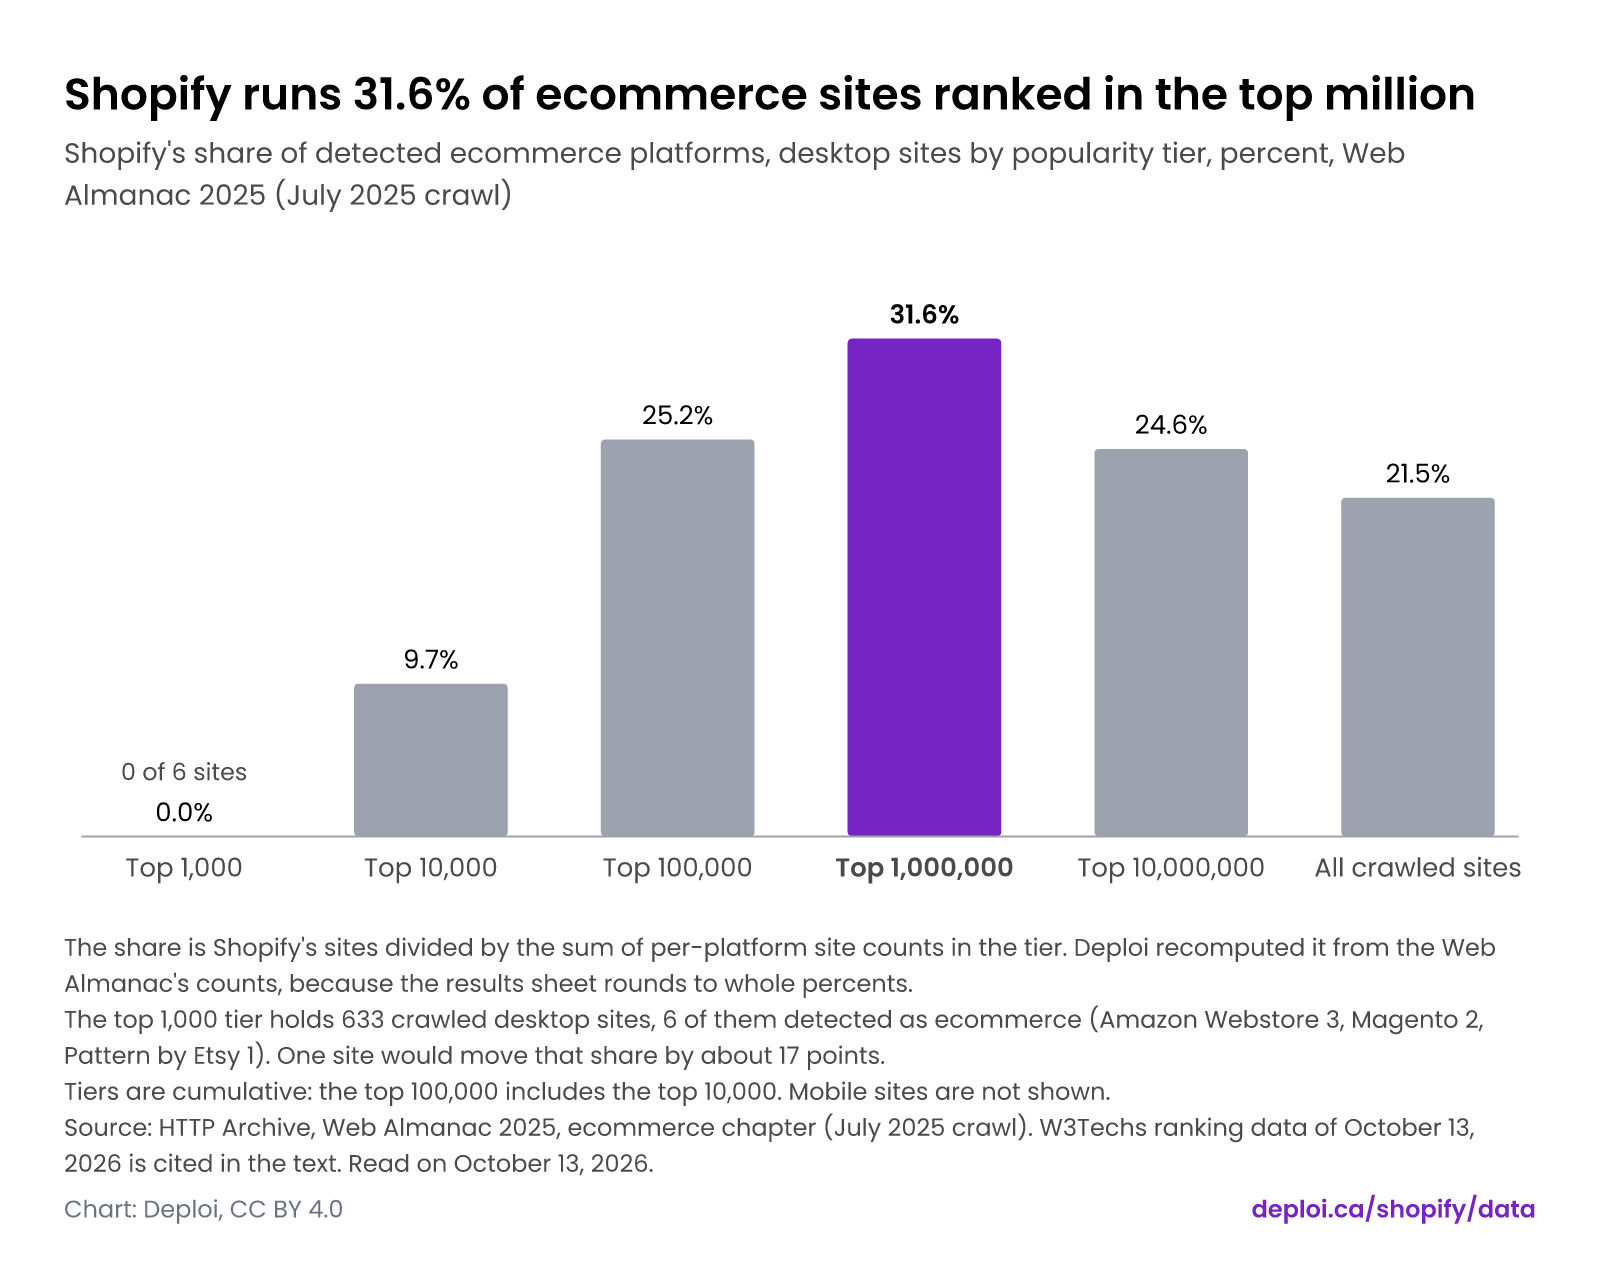
Shopify runs 31.6% of detected ecommerce platforms among the top 1,000,000 desktop sites in the HTTP Archive's Web Almanac 2025 (July 2025 crawl). The top 1,000 holds 6 ecommerce sites, and none runs Shopify. Across all crawled sites Shopify holds 21.5% of ecommerce platforms and 4.32% of all sites.
W3Techs measures a different base: sites with a known content management system. On October 13, 2026 W3Techs showed Shopify on 7.8% of those sites, 15.8% in the top million and 5.3% in the top 1,000. W3Techs also puts Shopify at 5.4% of all websites and 32.2% of ecommerce systems. The two sources use different rank lists and detection methods, so do not compare their percentages.
Shopify runs 31.6% of ecommerce sites ranked in the top million
Shopify's share of detected ecommerce platforms, desktop sites by popularity tier, percent, Web Almanac 2025 (July 2025 crawl)
- The share is Shopify's sites divided by the sum of per-platform site counts in the tier. Deploi recomputed it from the Web Almanac's counts, because the results sheet rounds to whole percents.
- The top 1,000 tier holds 633 crawled desktop sites, 6 of them detected as ecommerce (Amazon Webstore 3, Magento 2, Pattern by Etsy 1). One site would move that share by about 17 points.
- Tiers are cumulative: the top 100,000 includes the top 10,000. Mobile sites are not shown.
Source: HTTP Archive, Web Almanac 2025, ecommerce chapter (July 2025 crawl). W3Techs ranking data of October 13, 2026 is cited in the text. Read on .
At what sales level does Shopify Plus cost less than Advanced?
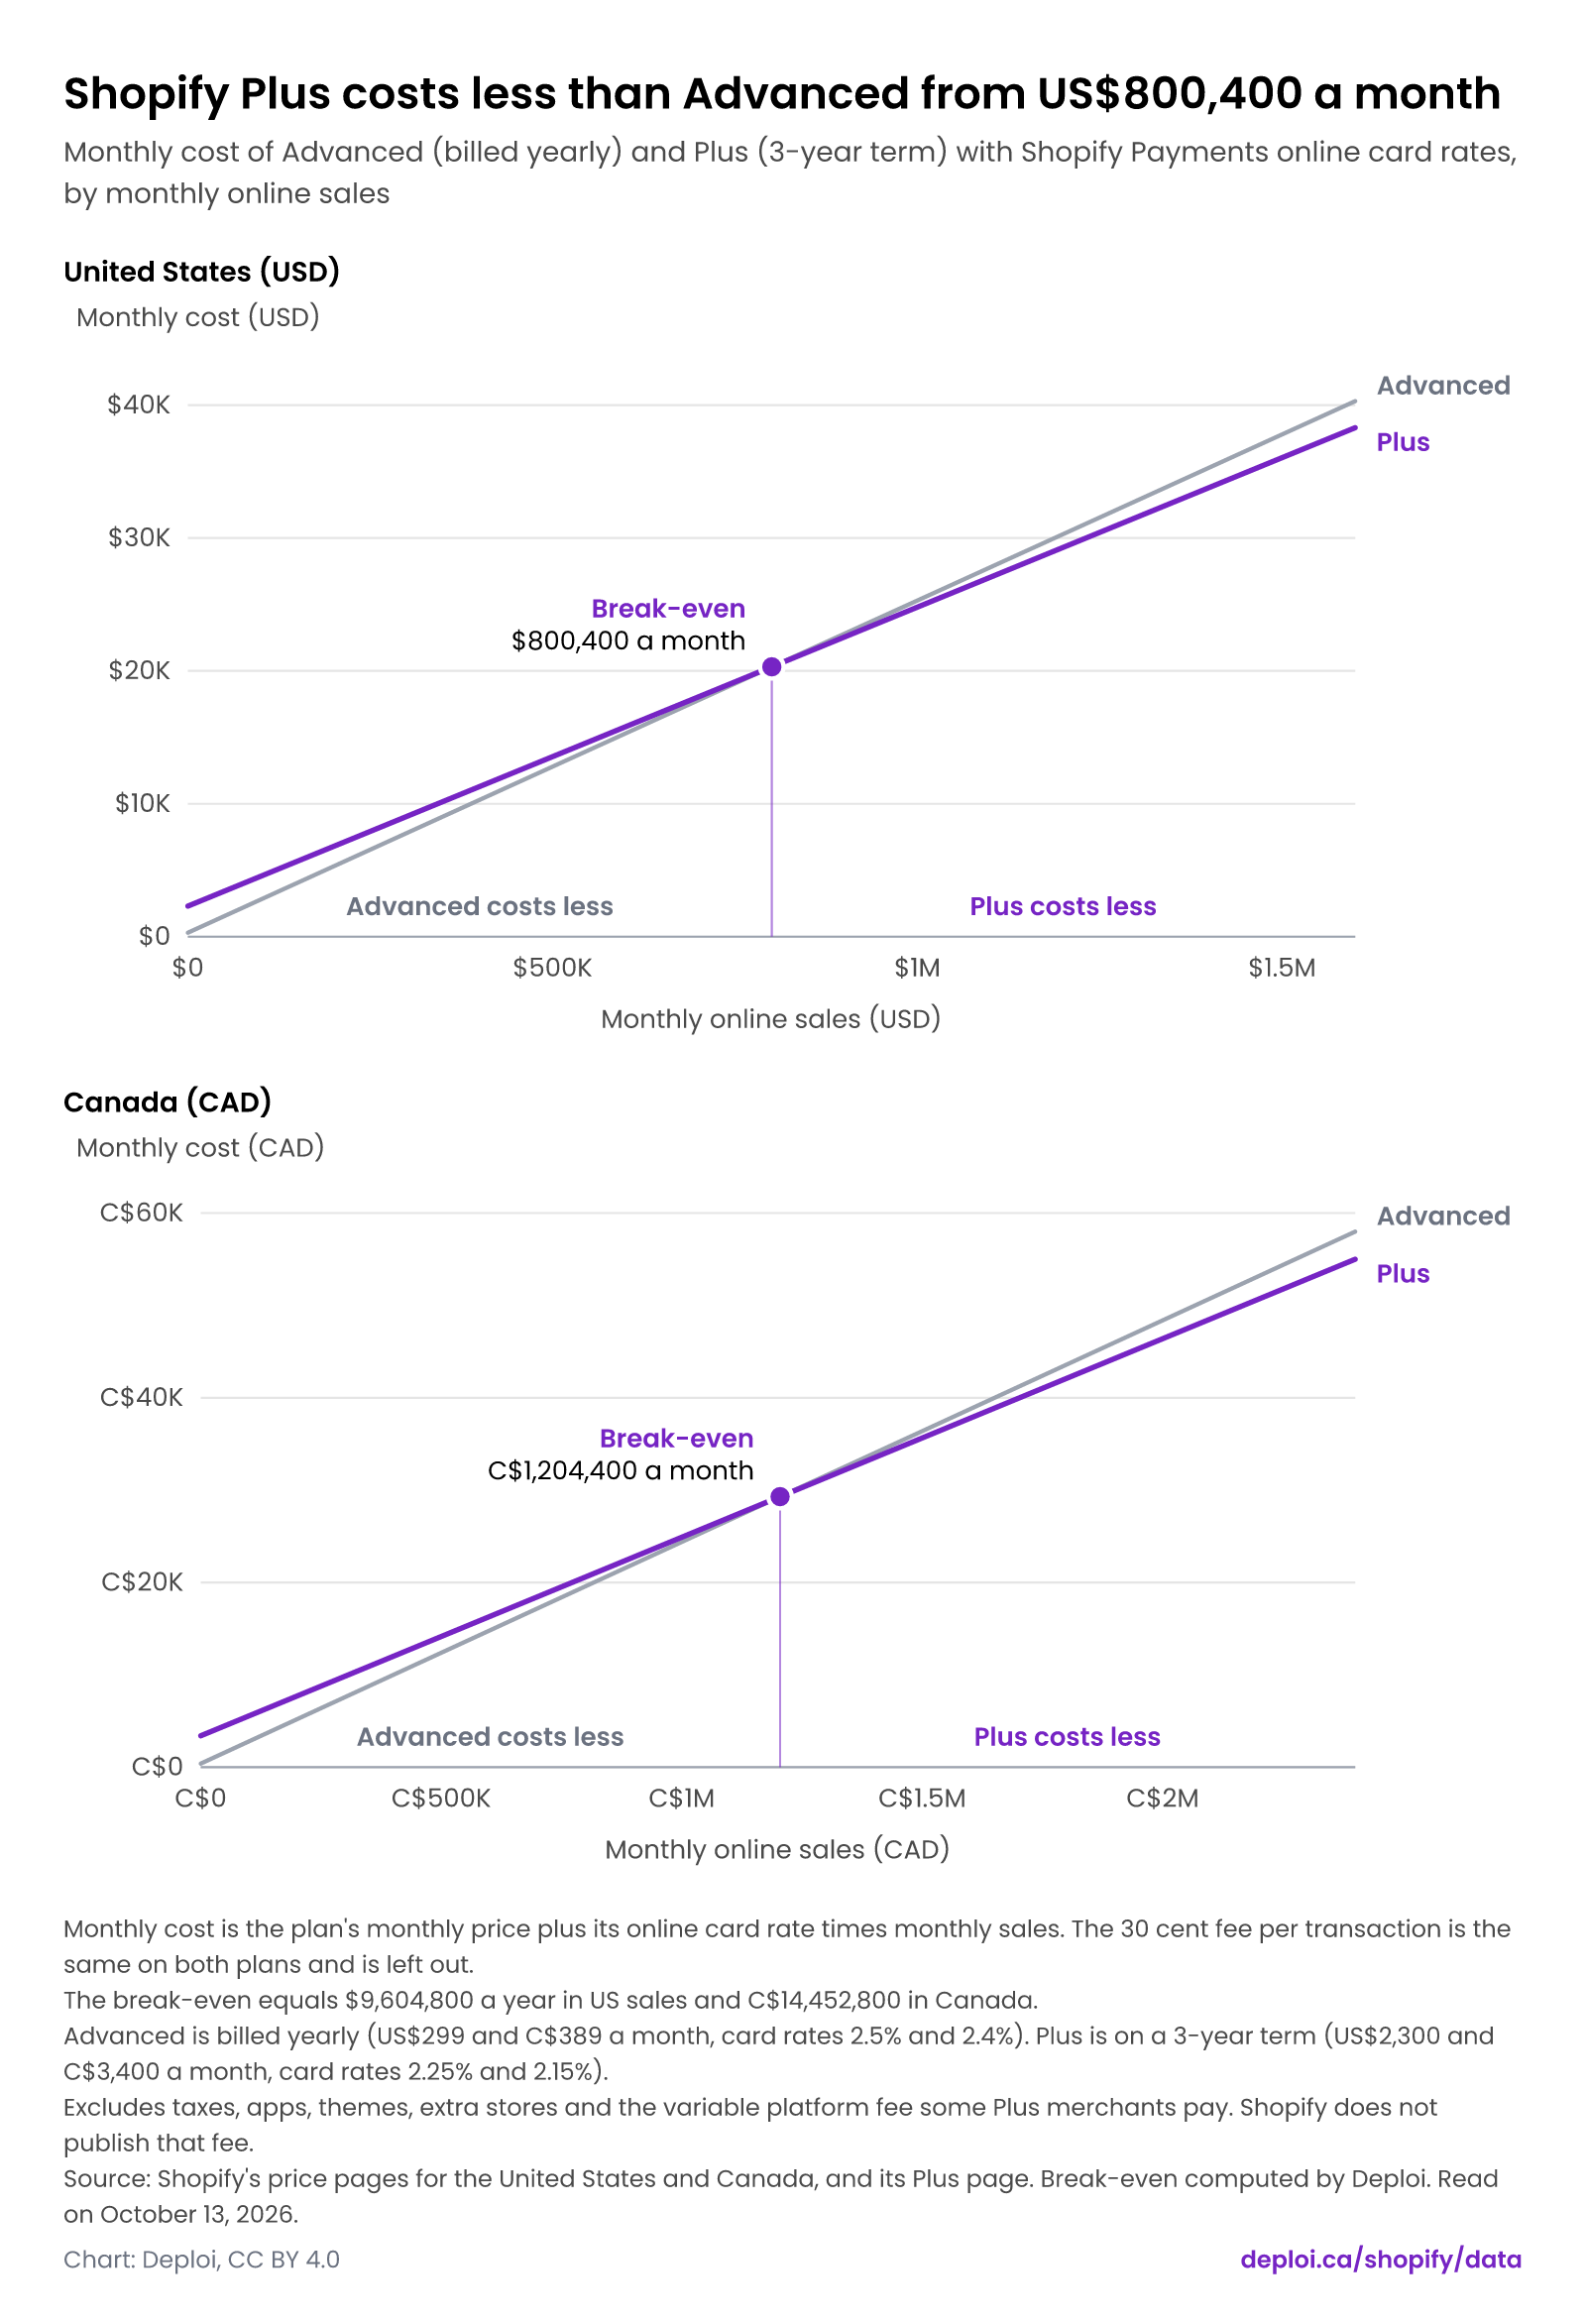
Shopify Plus on a 3-year term costs less than Advanced billed yearly above $800,400 a month in US online sales and C$1,204,400 in Canada. The prices and Shopify Payments card rates come from Shopify's price pages, read on October 13, 2026. Below those levels Advanced costs less.
The calculation adds each plan's monthly price to its online card rate times sales: 2.5% on Advanced and 2.25% on Plus in the US. On a 1-year Plus term the US break-even rises to $880,400. The comparison leaves out apps, taxes, extra stores and the variable platform fee some Plus merchants pay. With a third-party payment provider the US break-even on a 3-year term falls to $500,250 a month, because Shopify's third-party fee drops from 0.6% to 0.2%.
Shopify Plus costs less than Advanced from US$800,400 a month
Monthly cost of Advanced (billed yearly) and Plus (3-year term) with Shopify Payments online card rates, by monthly online sales
United States (USD)
Canada (CAD)
- Monthly cost is the plan's monthly price plus its online card rate times monthly sales. The 30 cent fee per transaction is the same on both plans and is left out.
- The break-even equals $9,604,800 a year in US sales and C$14,452,800 in Canada.
- Advanced is billed yearly (US$299 and C$389 a month, card rates 2.5% and 2.4%). Plus is on a 3-year term (US$2,300 and C$3,400 a month, card rates 2.25% and 2.15%).
- Excludes taxes, apps, themes, extra stores and the variable platform fee some Plus merchants pay. Shopify does not publish that fee.
Source: Shopify's price pages for the United States and Canada, and its Plus page. Break-even computed by Deploi. Read on .
Which Shopify numbers circulate but do not hold up?
Three Shopify numbers circulate and do not hold up: 6 to 7 million stores, 10.32% global market share and 29 to 30% of US ecommerce. All three describe websites, not merchants or sales. Shopify's own figures are approximately 2,063,000 merchants at year-end 2021 (annual information form) and over 14% of US ecommerce for 2025 (fourth-quarter release).
- "6 to 7 million Shopify stores." Counts like this tally websites that run Shopify software. A website is not a merchant: one merchant can run several stores, and detecting software does not measure trade. Shopify's last published merchant count is 2,063,000 at year-end 2021.
- "10.32% global market share." Technology trackers classify websites, so a share like this describes websites. On October 13, 2026 W3Techs put Shopify at 5.4% of all websites.
- "29 to 30% of US ecommerce." A share of ecommerce websites is not a share of sales. Shopify's own claim is a share of sales: over 14% for 2025.
These three figures are quoted claims, not Deploi data. None comes from Shopify, and Deploi has not traced them to a primary source. Live third-party counts are on BuiltWith's Shopify page and in Store Leads' Shopify report. Deploi links to them and does not reproduce their figures.
The data
Each chart on this page is drawn from the numbers below. Units are in the column headers.
Shopify GMV reached $378.4 billion in 2025
| Fiscal year | GMV (USD million) | GMV growth on prior year (%) |
|---|---|---|
| 2015 | 7,706.661 | Not stated |
| 2016 | 15,374.166 | 99.49 |
| 2017 | 26,320.15 | 71.2 |
| 2018 | 41,103.238 | 56.17 |
| 2019 | 61,138.457 | 48.74 |
| 2020 | 119,577.147 | 95.58 |
| 2021 | 175,361.814 | 46.65 |
| 2022 | 197,167 | 12.43 |
| 2023 | 235,910 | 19.65 |
| 2024 | 292,275 | 23.89 |
| 2025 | 378,441 | 29.48 |
Download Shopify annual metrics, fiscal years 2015 to 2025 as CSV · All 13 columns on the dataset page
Shopify BFCM sales hit $14.6 billion in 2025
| Year | BFCM sales (USD billion) | Sales as stated | Growth as stated (%) |
|---|---|---|---|
| 2017 | 1.0 | over $1 billion | Not stated |
| 2018 | 1.8 | $1.8+ billion | Not stated |
| 2019 | 2.9 | $2.9+ billion | Not stated |
| 2020 | 5.1 | $5.1+ billion | 76 |
| 2021 | 6.3 | $6.3 billion | 23 |
| 2022 | 7.5 | $7.5 billion | 19 |
| 2023 | 9.3 | $9.3 billion | 24 |
| 2024 | 11.5 | $11.5 billion | 24 |
| 2025 | 14.6 | $14.6 billion | 27 |
Download Shopify Black Friday-Cyber Monday sales by year as CSV · All 19 columns on the dataset page
Shopify Payments handled 65.6% of GMV in 2025
| Fiscal year | GPV (USD million) | GMV (USD million) | Shopify Payments penetration (% of GMV) |
|---|---|---|---|
| 2015 | 2,700 | 7,706.661 | 35.0 |
| 2016 | 5,900 | 15,374.166 | 38.0 |
| 2017 | 10,000 | 26,320.15 | 38.0 |
| 2018 | 16,600 | 41,103.238 | 40.4 |
| 2019 | 25,700 | 61,138.457 | 42.1 |
| 2020 | 53,900 | 119,577.147 | 45.1 |
| 2021 | 85,800 | 175,361.814 | 48.9 |
| 2022 | 106,100 | 197,167 | 53.8 |
| 2023 | 137,000 | 235,910 | 58.1 |
| 2024 | 181,000 | 292,275 | 61.9 |
| 2025 | 248,100 | 378,441 | 65.6 |
Download Shopify annual metrics, fiscal years 2015 to 2025 as CSV · All 13 columns on the dataset page
The US has 44% of Shopify's merchants but 63% of its revenue
| Region | Revenue by region (USD million) | Revenue share, as printed (%) | Share of merchants at December 31, as printed (%) |
|---|---|---|---|
| United States | 7,331 | 63 | 44 |
| EMEA | 2,426 | 21 | 31 |
| APAC | 1,128 | 10 | 16 |
| Canada | 567 | 5 | 5 |
| Latin America | 104 | 1 | 5 |
Download Shopify revenue and merchants by region as CSV · All 12 columns on the dataset page
Shopify last published a merchant count in 2021: 2,063,000
| Year | Merchants on the platform | Qualifier of the count | Countries, as stated |
|---|---|---|---|
| 2012 | 41,295 | exact | |
| 2013 | 84,073 | exact | |
| 2014 | 144,670 | exact | |
| 2015 | 243,468 | exact | approximately 150 countries |
| 2016 | 377,500 | more than | approximately 175 countries |
| 2017 | 609,000 | over | approximately 175 countries |
| 2018 | 820,000 | over | approximately 175 countries |
| 2019 | 1,069,000 | approximately | approximately 175 countries |
| 2020 | 1,749,000 | approximately | approximately 175 countries |
| 2021 | 2,063,000 | approximately | approximately 175 countries |
Download Shopify merchant counts at year-end, 2012 to 2025 as CSV · All 12 columns on the dataset page
Shopify runs 31.6% of ecommerce sites ranked in the top million
| Site popularity tier | Share recomputed from counts (%) | Shopify share as published (%) |
|---|---|---|
| Top 1,000 | 0.0 | 0.0 |
| Top 10,000 | 9.7 | 10.0 |
| Top 100,000 | 25.2 | 25.0 |
| Top 1,000,000 | 31.6 | 32.0 |
| Top 10,000,000 | 24.6 | 25.0 |
| All crawled sites | 21.5 | 21.5 |
Download Shopify adoption by site popularity tier as CSV · All 15 columns on the dataset page
Shopify Plus costs less than Advanced from US$800,400 a month
| Monthly online sales (USD) | Advanced plan: monthly cost (USD) | Plus plan: monthly cost (USD) | Lower cost |
|---|---|---|---|
| $0 | $299 | $2,300 | Advanced |
| $200,000 | $5,299 | $6,800 | Advanced |
| $400,000 | $10,299 | $11,300 | Advanced |
| $600,000 | $15,299 | $15,800 | Advanced |
| $800,000 | $20,299 | $20,300 | Advanced |
| $800,400 (break-even) | $20,309 | $20,309 | Equal |
| $1,000,000 | $25,299 | $24,800 | Plus |
| $1,200,000 | $30,299 | $29,300 | Plus |
| $1,400,000 | $35,299 | $33,800 | Plus |
| $1,600,000 | $40,299 | $38,300 | Plus |
Monthly cost = fixed fee + rate x monthly sales. Advanced: $299 + 2.5% of sales. Plus: $2,300 + 2.25% of sales.
| Monthly online sales (CAD) | Advanced plan: monthly cost (CAD) | Plus plan: monthly cost (CAD) | Lower cost |
|---|---|---|---|
| C$0 | C$389 | C$3,400 | Advanced |
| C$300,000 | C$7,589 | C$9,850 | Advanced |
| C$600,000 | C$14,789 | C$16,300 | Advanced |
| C$900,000 | C$21,989 | C$22,750 | Advanced |
| C$1,200,000 | C$29,189 | C$29,200 | Advanced |
| C$1,204,400 (break-even) | C$29,295 | C$29,295 | Equal |
| C$1,500,000 | C$36,389 | C$35,650 | Plus |
| C$1,800,000 | C$43,589 | C$42,100 | Plus |
| C$2,100,000 | C$50,789 | C$48,550 | Plus |
| C$2,400,000 | C$57,989 | C$55,000 | Plus |
Monthly cost = fixed fee + rate x monthly sales. Advanced: C$389 + 2.4% of sales. Plus: C$3,400 + 2.15% of sales.
Download Shopify plan prices and payment fees, US and Canada as CSV · Dataset page
Methodology
Reading the chart: Shopify GMV reached $378.4 billion in 2025
- GMV is the total value of orders processed on the platform. Shopify says it does not represent revenue earned by Shopify, and it is not audited.
- Shopify widened its GMV wording with the Q4 2019 results to include certain apps and channels, so growth from 2018 to 2019 is not strictly like for like.
Reading the chart: Shopify BFCM sales hit $14.6 billion in 2025
- 2017 is Shopify's "over $1 billion". Shopify prints 2018, 2019 and 2020 with a plus sign ($1.8+, $2.9+ and $5.1+ billion), so those are lower bounds.
- 2018 is the restated $1.8 billion. Shopify first announced $1.5 billion and did not say why the figure changed.
- Shopify calls the figures approximate and unaudited. The measurement window and the definition of sales change between years, so prior years are not directly comparable.
Reading the chart: Shopify revenue reached 3.05% of GMV in 2025
- Revenue includes subscriptions, payments and other services, so the ratio is an average across all merchants and not a fee rate.
- Revenue through 2022 includes the logistics businesses Shopify sold in 2023. Shopify does not quantify the effect on annual revenue.
Reading the chart: Shopify Payments handled 65.6% of GMV in 2025
- Shopify states the share as a whole percent for 2015 to 2017 and to one decimal from 2018.
- Penetration is Shopify's management metric: payments volume divided by GMV. It is not audited.
Reading the chart: The US has 44% of Shopify's merchants but 63% of its revenue
- Region is where the merchant is located, not where the buyer is. EMEA (usually Europe, the Middle East and Africa) and APAC (usually Asia-Pacific) are Shopify's labels, and the Form 10-K does not define them.
- Revenue shares are the whole percents Shopify prints, and they add to 100. Merchant shares add to 101 because of rounding. Canada is 5% on both measures, so its two dots overlap.
- The United States produced $7,331 million of $11,556 million. Shopify no longer gives a merchant count, so merchant shares cannot be turned into counts.
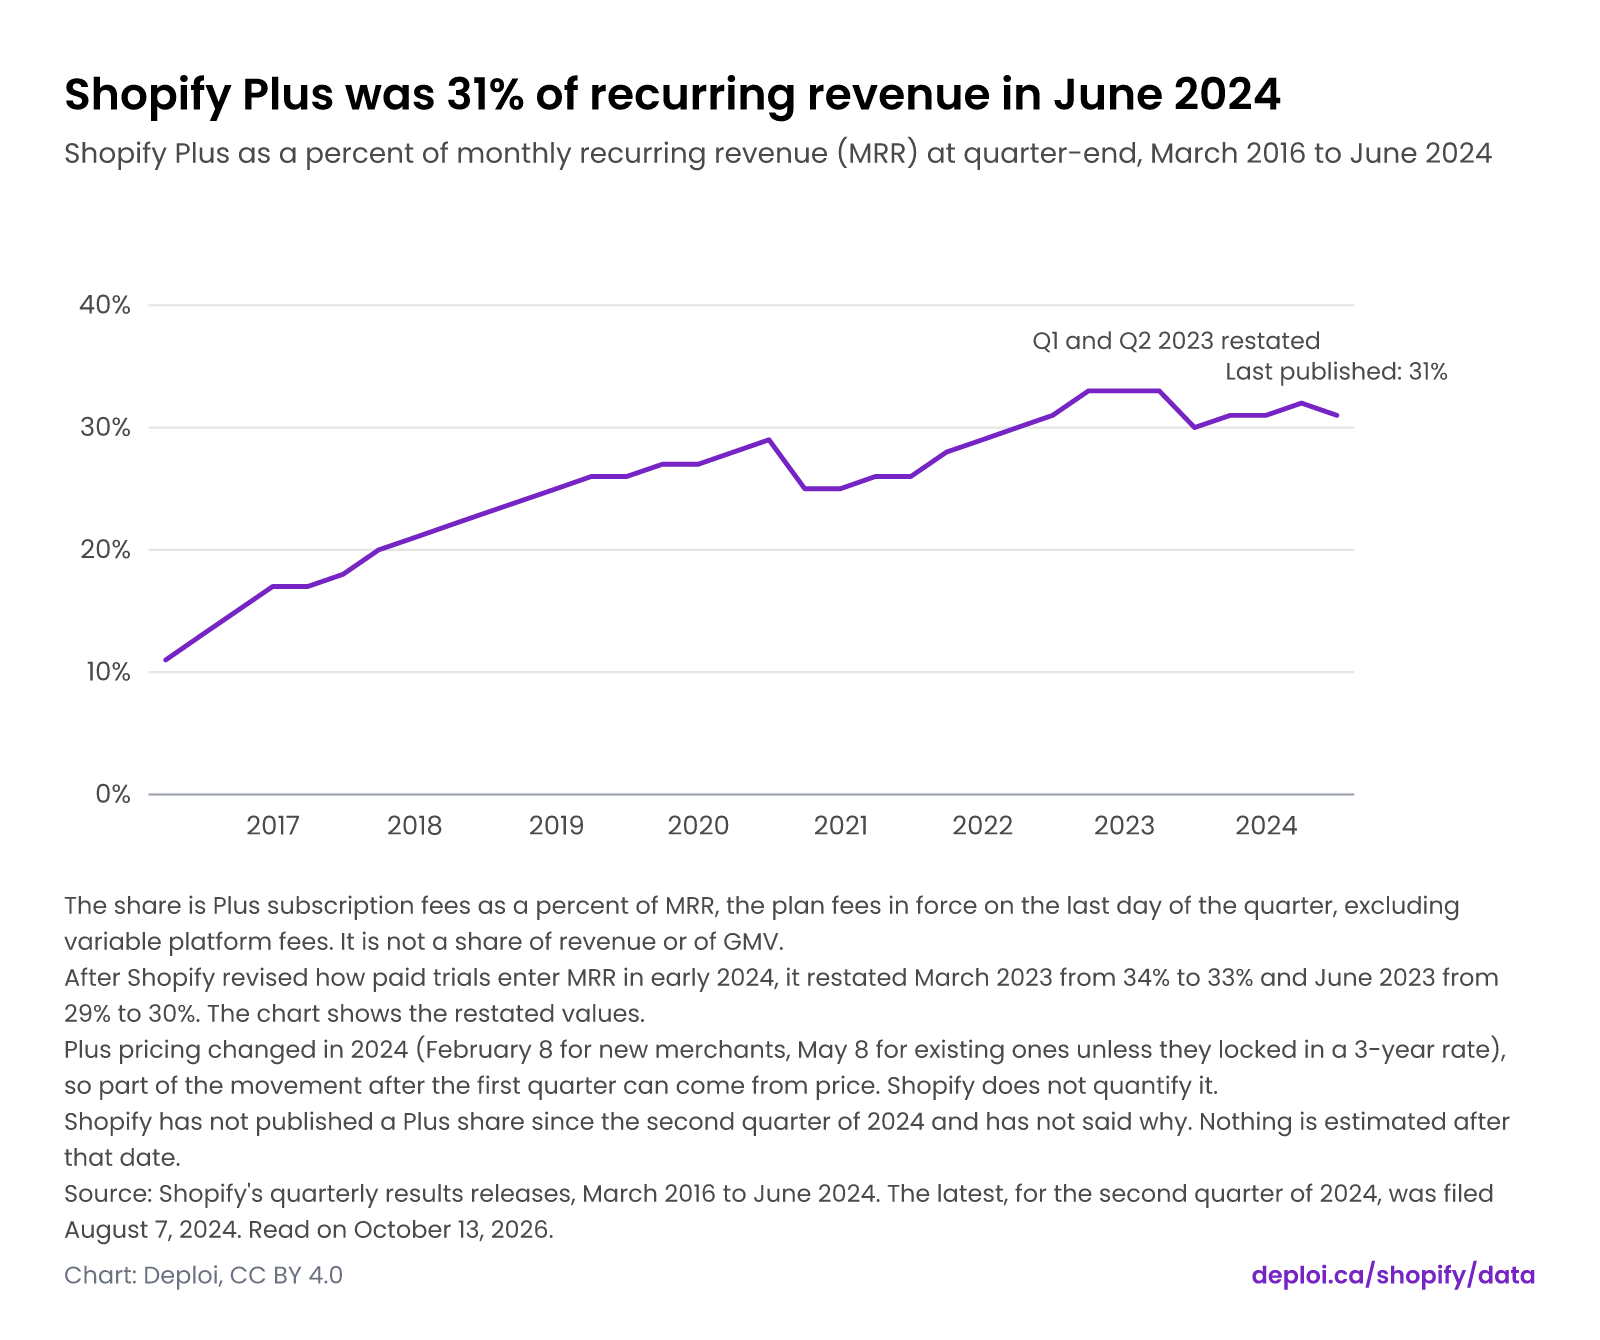
Reading the chart: Shopify Plus was 31% of recurring revenue in June 2024
- The share is Plus subscription fees as a percent of MRR, the plan fees in force on the last day of the quarter, excluding variable platform fees. It is not a share of revenue or of GMV.
- After Shopify revised how paid trials enter MRR in early 2024, it restated March 2023 from 34% to 33% and June 2023 from 29% to 30%. The chart shows the restated values.
- Plus pricing changed in 2024 (February 8 for new merchants, May 8 for existing ones unless they locked in a 3-year rate), so part of the movement after the first quarter can come from price. Shopify does not quantify it.
- Shopify has not published a Plus share since the second quarter of 2024 and has not said why. Nothing is estimated after that date.
Reading the chart: Shopify last published a merchant count in 2021: 2,063,000
- Shopify does not define merchant for this count, and its documents do not say whether trial, paused or free accounts are included.
- Counts from 2016 are rounded by Shopify. The qualifier (more than, over, approximately) varies between documents for the same number.
- Counts of Shopify stores from web crawls and other third parties measure something else and are not used.
Reading the chart: Shopify claims over 14% of US ecommerce sales
- Over means more than: Shopify prints ">10%", ">12%" and ">14%", so the steps between years are not measured changes.
- The market size comes from eMarketer for 2021, the US Census Bureau for 2022 and 2023, and Census data plus Shopify's internal estimates for 2024 and 2025.
- Shopify's 2019 claim is a rank (second-largest US ecommerce retailer) with no percentage, and it gives no figure for 2020.
Reading the chart: Shopify runs 31.6% of ecommerce sites ranked in the top million
- The share is Shopify's sites divided by the sum of per-platform site counts in the tier. Deploi recomputed it from the Web Almanac's counts, because the results sheet rounds to whole percents.
- The top 1,000 tier holds 633 crawled desktop sites, 6 of them detected as ecommerce (Amazon Webstore 3, Magento 2, Pattern by Etsy 1). One site would move that share by about 17 points.
- Tiers are cumulative: the top 100,000 includes the top 10,000. Mobile sites are not shown.
Reading the chart: Shopify Plus costs less than Advanced from US$800,400 a month
- Monthly cost is the plan's monthly price plus its online card rate times monthly sales. The 30 cent fee per transaction is the same on both plans and is left out.
- The break-even equals $9,604,800 a year in US sales and C$14,452,800 in Canada.
- Advanced is billed yearly (US$299 and C$389 a month, card rates 2.5% and 2.4%). Plus is on a 3-year term (US$2,300 and C$3,400 a month, card rates 2.25% and 2.15%).
- Excludes taxes, apps, themes, extra stores and the variable platform fee some Plus merchants pay. Shopify does not publish that fee.
Caveats: Shopify annual metrics, fiscal years 2015 to 2025
- Fiscal year equals calendar year in every row. The 10-K cover reads "For the fiscal year ended December 31, 2025". The annual report form changed over the period: Form 20-F for FY2015, Form 40-F for FY2016 to FY2023 (with quarterly results on Form 6-K) and Form 10-K from FY2024.
- Each value is the figure in the most recently filed annual report that states the fiscal year, so a later restatement replaces the earlier number. Where only rounding differs, the later rounded figure is published and the finer one is in the row note (FY2022 revenue 5,599.864 against 5,600; FY2022 GMV 197,166.882 against 197,167). Annual reports through FY2022 give GMV and MRR in thousands of dollars; from the FY2023 MD&A they give whole millions.
- Revenue is read by script from SEC XBRL. Shopify's XBRL tag for total revenue changed over time, which changes no number, and Subscription Solutions plus Merchant Solutions equals total revenue in every year. Subscription Solutions includes variable platform fees. The SEC companyfacts API omits dimensional facts, so the two revenue lines from FY2017 come from each filing's XBRL instance document.
- GMV is a management metric, not revenue ("GMV does not represent revenue earned by us."), and sits outside the audited statements, as do MRR, GPV and penetration. The GMV wording widened with the Q4 2019 results to include "certain apps and channels for which a revenue-sharing arrangement is in place". The FY2019 MD&A shows the same 2018 figure as the FY2018 MD&A, so 2018 was not recast, and Shopify does not quantify the effect. Growth from 2018 to 2019 is therefore not strictly like for like.
- MRR is the monthly subscription plan fees in force on the last day of the period, excluding variable platform fees. It is not revenue. In the first quarter of 2024 Shopify revised how paid trials enter MRR, which lowered December 31, 2023 from $149 million as first published to $144 million. MRR at December 31, 2022 moved without explanation: $109.5 million in the Q4 2022 release, $110 million in the FY2023 MD&A and $109 million in the FY2024 Form 10-K, the value used here. The Q2 2025 release reworded the MRR definition and changed no value.
- Shopify sold its logistics businesses in the second quarter of 2023 ("On June 6, 2023, the majority of our logistics businesses were sold to Flexport"). Their revenue was reported in Merchant Solutions, so FY2015 to FY2022 and part of FY2023 include revenue that FY2024 and FY2025 do not. Shopify quantifies the effect by quarter only, and this dataset does not adjust revenue. Read growth across 2023 and 2024 with that in mind.
- GPV (gross payments volume) is the part of GMV processed through Shopify Payments. Penetration is GPV divided by GMV: a whole percent for FY2015 to FY2017 (results releases) and one decimal from FY2018 (MD&A and Form 10-K). Shopify states GPV in billions to one decimal, so each GPV value carries a rounding band of plus or minus 50 USD million, and the recomputed ratio agrees with the stated penetration in every row within that band. The Q4 2024 and Q4 2025 releases give no dollar GPV, so FY2024 and FY2025 rest on the Form 10-K.
- Three columns are Deploi's arithmetic and not Shopify statements: gmvGrowthPct and revenueGrowthPct (each year against the year before) and revenueShareOfGmvPct (revenue divided by GMV). Each is rounded to two decimals, and the formula for every value is in the provenance table. All amounts are US dollars ("Shopify reports in U.S. dollars and in accordance with U.S. GAAP").
- The series starts at FY2015 because GPV and penetration were first published, as 2015 comparatives, in the Q4 2016 results release.
Caveats: Shopify Black Friday-Cyber Monday sales by year
- Shopify calls the figures approximate and unaudited. The 2017 page says: "All data presented here is approximate and is based on various assumptions. All data is unaudited and is subject to adjustment." The 2023 to 2025 releases add that the methodology "may vary year on year and prior year results are not directly comparable to current results." Treat year-over-year comparisons as indicative.
- Shopify does not define sales before 2023. From 2023 it defines sales as gross merchandise volume (GMV), covering online and offline sales: the total dollar value of orders on the platform, net of refunds and inclusive of shipping and handling, duty and value-added taxes. GMV is not Shopify revenue and not merchants' net sales.
- The measurement window changes by year. The 2017 and 2018 pages give dates without a time zone. The 2019 and 2020 windows run from UTC+13 to Pacific time. The 2021 to 2023 windows run from Thursday 11:00 UTC to Tuesday 08:00 UTC. The 2024 and 2025 releases say only "early Friday in New Zealand to late Monday in California". Black Friday falls on a different date each year, so the windows are not identical spans.
- 2018 was restated. Shopify first announced "over $1.5 billion" and later called it $1.8+ billion in its 2019 release and its Q4 2019 results release, without giving a reason. The column salesUsdB holds the latest stated value (1.8) and originalSalesUsdB the first-announced value (1.5).
- Growth rates are Shopify's own stated percentages, in nominal US dollars unless the constant-currency column is filled (2022: 21%, 2025: 24%). The 2017 to 2019 releases state none. Deploi recomputed each stated rate from the stated levels, and every one agrees within one percentage point, the size of the rounding in Shopify's levels.
- Buyer counts are not like for like. The 2019 count uses an Eastern time window, the 2025 count is "based on unique buyer emails", and the 2022 consumer-growth percentage was corrected from 18% to 12% in a Form 6-K/A filed the same day. The 2017 and 2018 releases state merchant counts only, not buyers.
- Stated levels carry qualifiers: "over" (2017, and 2018 as first announced), a plus sign (2019, 2020 and 2018 as restated) or none (2021 to 2025). Treat qualified values as lower bounds.
- SEC coverage. Each of 2020 to 2025 has a dedicated BFCM exhibit (Form 6-K, then Form 8-K from 2025). For 2017, 2018 and 2019 Shopify filed no standalone BFCM release, so the SEC copy of the figure is in the following February's Q4 results release. Shopify's Q4 2016 release gives no dollar total for BFCM 2016, so 2017 is the first dollar figure.
- Where an SEC exhibit and Shopify's page differ in wording or typos, the page supplies the fields; the sales figure agrees between the two for every year. Example: the 2024 exhibit reads "116,500+" first-sale entrepreneurs where the page reads "16,500+". Black Friday-day-only announcements and interim updates are not weekend totals and are excluded. All sales figures are US dollars, and the pages were read on October 13, 2026.
Caveats: Shopify revenue and merchants by region
- Revenue is Shopify's total revenue (Subscription Solutions plus Merchant Solutions), not gross merchandise volume. It is attributed by where Shopify's merchants are located, not where buyers are: "The following table presents total external revenues by geographic location, based on the location of the Company’s merchants". The Form 10-K does not define EMEA, APAC or Latin America. Amounts are US dollars as reported, not constant currency.
- Scope: fiscal years 2022 to 2025, the years shown in the two latest Forms 10-K. Each year uses the most recently filed report that states it (2022 from the 10-K for 2024, 2023 to 2025 from the 10-K for 2025). The two reports agree for 2023 and 2024, every amount equals the XBRL fact of the same filing, and total revenue equals the total in the annual-metrics dataset for every year.
- Two kinds of percentages. revenueSharePctStated is the whole-number percentage Shopify prints, and the printed percentages add to 100. revenueSharePctComputed is revenue divided by total revenue times 100, to one decimal. They differ by more than 0.5 point in two rows: FY2024 Canada (printed 6%, computed 5.4%) and FY2022 United States (printed 67%, computed 66.4%). Largest-remainder rounding reproduces Shopify's printed percentages in all four years, but Shopify does not state its method. To quote Shopify, use the printed share. For analysis, use the computed share.
- FY2022 amounts were rounded after first publication. The Form 40-F for 2022 (filed 2023-02-16, XBRL, to the thousand) had United States 3,719.489, Canada 345.915, EMEA 917.116, APAC 553.361 and Latin America 63.983, a total of 5,599.864 USD million. Later filings print whole millions, and the printed United States amount (3,720) is not the rounded first-filed one (3,719). Shopify gives no reason, and the printed regions add to the printed total of 5,600.
- Region labels change in 2026. From the first quarter of 2026 Shopify reports Europe and Rest of World instead of EMEA and Latin America. In the Q1 2025 comparative column, EMEA plus Latin America (480 + 22) equals Europe plus Rest of World (461 + 41), which is 502 million, and the United States, Canada, APAC and total lines are unchanged. Neither Form 10-Q defines the new groups or mentions the change, so annual 2026 figures may not be comparable with the EMEA and Latin America rows here.
- Merchant shares are shares of the number of merchants, not of revenue, and not revenue per merchant. They are whole percentages at December 31 from Shopify's sentence, for 2025: "As of December 31, 2025, we had millions of merchants from more than 175 countries using our platform, geographically dispersed as follows: 44% in the United States, 31% in Europe, the Middle East and Africa, 16% in Asia Pacific, Australia and China, 5% in Canada and 5% in Latin America." They add to 100 for 2022 to 2024 and to 101 for 2025. For 2022 and 2023 Shopify gives one North America figure (55% and 54%), so the United States and Canada rows have no separate merchant share. The merchant and revenue labels are paired by name, and nothing in the 10-K says the groupings are identical. Shopify no longer gives a merchant count, so shares cannot be turned into counts.
Caveats: Shopify Plus share of monthly recurring revenue
- What the number is. Shopify states it as a share of MRR, for example "Shopify Plus contributed $3.5 million, or 17%, of MRR compared with 11% of MRR as of March 31, 2016." (Q1 2017 results release, the first such sentence). MRR is the subscription plan fees in force on the last day of the quarter, so the share excludes variable platform fees, apps, themes, domains and payments. It is not Plus's share of revenue or of GMV. MRR and the Plus share are management's operating metrics: unaudited and not tagged in XBRL.
- Coverage. Shopify first printed a Plus share in the Q1 2017 results release, with March 31, 2016 as a comparative; the 2016 quarter-ends rest on the prior-year comparatives in the four 2017 releases. The last statement is for June 30, 2024: "Shopify Plus contributed $52 million, or 31%, of MRR" (Q2 2024 results release). A search of the eight results releases from Q3 2024 to Q2 2026, the quarterly MD&As, the Forms 10-K for 2024 and 2025 and the Forms 10-Q found no Plus share of MRR, and Shopify has not explained the change. The dataset ends at June 30, 2024 and nothing is estimated after it.
- Rounding. Shares are whole percents. Plus MRR is stated to $0.1 million up to the Q4 2022 release and to whole millions from the Q1 2023 release, so a ratio of the two can differ from the stated percent by about a point. All 30 own-quarter pairs are consistent with the stated share.
- Restatements. After Shopify revised how paid trials enter MRR in the first quarter of 2024, two shares were restated: March 31, 2023 from 34% to 33% and June 30, 2023 from 29% to 30%. The published values are the later ones, and the first statements are in plusSharePctFirst. The shares for September 30 and December 31, 2023 (31% each) were stated before the revision and never restated, so they sit on the old MRR basis (column mrrBasis). Shopify publishes no revised Plus dollar amounts, and the restated March 2023 share cannot be reproduced from the dollar amount first published, even allowing for rounding.
- Contradiction for December 31, 2022. The Q4 2022 release says 33%, the text of the Q4 2023 release repeats 33%, and the table of the Q4 2023 release prints 34%. The dataset publishes 33% because two statements agree. The 34% and the arithmetic on the four total-MRR figures Shopify has printed for that date are in the row note.
- Shopify's explanations. In six releases (Q3 2020, Q4 2020, Q1 2021, Q2 2021, Q1 2022 and Q2 2022) Shopify explains the change from the prior-year share in the same sentence, and the clause is quoted in the row note. A falling share does not mean falling Plus MRR: the Plus dollar amounts as first stated rose in every quarter from Q1 2017 to Q2 2024.
- Other charts are not this measure. Shopify's investor decks chart Plus as a slice of subscription solutions revenue, not of MRR, and still do after the results releases stopped giving the share. Those percentages are a different measure and are not extracted here.
- Price effects. Shopify changed Plus pricing in 2024. Updated pricing took effect for new merchants on February 8, 2024 and for existing merchants on May 8, 2024, unless they locked in their 2023 rate with a 3-year commitment. Part of any movement in the share after the first quarter of 2024 can therefore come from price rather than merchant counts, and Shopify does not quantify it.
- totalMrrUsdM is total MRR as printed in the same release as the share (first publication). It can differ from the latest value in the annual-metrics dataset: 2022-12-31 is 109.5 here against 109 there, and 2023-12-31 is 149 here against 144 there. totalMrrRevisedUsdM gives the revised 2023 totals (114, 135, 137 and 144) from the Q1 2024 release.
Caveats: Shopify merchant counts at year-end, 2012 to 2025
- What is counted. Shopify does not define "merchant" for this count, and the wording varies: "merchants using our platform" (prospectus and annual information forms), "merchants subscribed to our platform" (Form 20-F for 2015). The documents do not say whether trial, paused or free accounts are included. Do not equate the count with paying merchants or with MRR, which Shopify calculates from a different group. None of the 64 documents read (prospectus, Form 20-F, annual information forms, MD&As, Forms 10-K and results releases) gives a number of paying merchants.
- Rounding and qualifiers. From 2016 the counts are round figures (377,500; 609,000; 820,000; 1,069,000; 1,749,000; 2,063,000). The qualifier differs between documents for the same number: "more than" or "over" in the annual information forms for 2016 to 2018, "approximately" in the MD&As and the Q4 2016 results release. The prospectus and Form 20-F give exact counts. For 2019 the annual information form says only "over one million", so the number comes from the MD&A. Every numeric statement for a year agrees.
- End of the numeric series. The last year with a number is 2021: approximately 2,063,000 merchants from approximately 175 countries. From the annual information form for 2022 Shopify says "millions of merchants", and the Forms 10-K for 2024 and 2025 repeat it. The investor decks say "Millions of merchants in 175+ countries". The MD&A sentence that gave the number (FY2017 to FY2020) is absent from the FY2021 MD&A and every later annual report. Any later "number of Shopify merchants" comes from outside Shopify's filings and decks and is not in this dataset.
- Shopify has not explained the change in wording in the documents read. Its closest statement is its August 6, 2025 response to an SEC staff comment on the Form 10-K for 2024. The staff asked how management uses the number of paying merchants and for that number for each period. Shopify answered that "the number of paying merchants has become less relevant to understanding Shopify’s overall business" and that "Management does not look to the number of paying merchants as a key performance indicator." The response gives no number of paying merchants and does not mention the annual information form's wording.
- Other figures are not year-end counts and are not used. The prospectus gives 162,261 merchants at March 31, 2015, and Shopify's 2019 Year in Review says "In 2015, 165,000 merchants were using Shopify.", which does not match the 243,468 in the Form 20-F for December 31, 2015 and has no stated date or basis.
- Regional splits are not a like-for-like series: countries until 2019, regions from 2020, and the United States and Canada separately from 2024. The percentages are whole numbers and do not always add to 100 (2017: 99; 2018: 101; 2025: 101). The FY2024 and FY2025 splits are also used in the revenue-by-region dataset.
- Third-party counts of Shopify stores, from web crawls, app trackers and analyst estimates, are not Shopify statements and count different things. They are not used here. The numberPublished column is Deploi's flag: yes where Shopify gives a number, no where it says only "millions of merchants".
Caveats: Shopify's stated share of US ecommerce
- What the figure is. Shopify's footnote says: "Shopify market share represents sales by Shopify merchants based on Shopify’s 2025 US GMV (excluding merchant sales made through POS)." The market size comes from the source the footnote names (eMarketer, then the US Census Bureau, then Census data with internal estimates). "GMV does not represent revenue earned by us." None of the 74 SEC filings and exhibits read, and none of the decks, gives Shopify's US GMV, so the percentages cannot be recomputed. Shopify does not say whether its GMV is adjusted to the scope of the market figure.
- Rounding and direction. Percentages are whole numbers printed with a symbol: "~" (about), "Over" or ">" (more than), or none. "Over 10%", ">12%" and ">14%" are lower bounds, so the step from 10% (2022) to over 12% (2024) to over 14% (2025) is not a measured change. The one figure with a decimal, 10.3% for 2021, is a chart label in the slide image of the Q2 2022 deck and is given in the 2021 row note only.
- The market-size source changes, so the years are not like for like. For 2021, and for 2022 in the Q4 2022 deck, it is eMarketer. From the Q1 2023 deck it is the US Census Bureau. In the Q4 2024 and Q4 2025 results releases it is "a combination of US Census Bureau data (Quarterly Retail E-Commerce Sales, not adjusted) and internal estimates". The decks for Q1 to Q3 2025 say Census data "for 2024" without internal estimates. Shopify does not say how large the estimates are or why its releases and decks word the market differently.
- The column year is the year of the GMV on which the share is based, not the year of the statement. A year's share first appears in the next February's results material, except 2021 (Q2 2022 deck) and 2023 (Q1 2024 deck). The statement of record is the latest statement Shopify filed with the SEC for that year (the Q4 2024 and Q4 2025 results releases). For the other years it is the latest quarterly Investor Overview deck, which Shopify publishes on its investor site and does not file with the SEC. All 17 statements are recorded in the provenance.
- Gaps. There is no statement for 2020, and the 2019 row is a rank, not a percentage. Decks not found: Q4 2023, Q3 2024, Q1 2026, Q2 2026 and every deck before Q2 2022. They may exist, so a claim may be older than the first statement shown, and the 2025 figure may have been restated in a 2026 deck. The Q1 and Q2 2026 results releases and Forms 10-Q contain no US share statement.
- Other market-share statements are not US ecommerce share and are not in the table. The Investor Day 2023 presentation says "~6% of ecommerce in Western Europe" and "less than 1% market share of global retail sales". The 2022 results releases compare Shopify's growth with the US retail market and give no share. Third-party estimates of Shopify's share are not Shopify statements and are not used.
Caveats: Shopify adoption by site popularity tier
- Two measurements, three bases; do not merge or compare them as one series. W3Techs' percentages are shares of "all the websites whose content management system we know" at ranks up to N. The Web Almanac ecommerce share is Shopify's share of the ecommerce platform detections in the tier, and its all-sites share divides by every desktop site crawled in the tier. Neither source counts merchants, stores or revenue.
- W3Techs numbers are one reading taken on October 13, 2026 and change daily. No history was captured. W3Techs' terms permit quoting with a dated reference and, online, a link to the original page. Cite as "W3Techs.com, 13 October 2026" with a link to the ranking page. All rights in the site belong to its owner, so only the quoted figures are reproduced.
- Rank lists differ. W3Techs uses "ranking data provided by Google in the Chrome User Experience Report (CrUX) as well as a customized version of the Tranco list". The Web Almanac uses the CrUX rank magnitude of each site, with cumulative tiers. A site's tier can differ between the two sources.
- Detection methods differ. W3Techs says "If we find a technology on any of the pages, it is considered to be used by the website" and "We do not consider subdomains to be separate websites", so a Shopify store on a subdomain counts as Shopify use by the whole site. The Web Almanac crawls the home page and one other page per site and client, and "If the store is hosted in a subdirectory, it may be missed." These differences are one reason the top-tier shares differ: W3Techs shows 5.3% of known-CMS sites in the top 1,000, and the Web Almanac shows 0 of 6 detected ecommerce sites.
- The Web Almanac top 1,000 tier is a very small sample: 633 desktop sites, 6 of them detected as ecommerce (Amazon Webstore 3, Magento 2, Pattern by Etsy 1), none Shopify. One site would move that share by about 17 points.
- Web Almanac denominator. The sheet's ecommerce share is Shopify's sites divided by the sum of the per-platform site counts in the tier, so a site detected with two ecommerce platforms counts twice. Recomputing reproduces the published value for all 2,159 rows of the sheet. Dividing by distinct ecommerce sites gives slightly higher shares (524,617 / 2,419,801 is 21.7% against the published 21.5%). The sheet rounds tier shares to whole percents except the All tier, where the chapter prints 21.5%, and sharePctRecomputed gives one decimal from the sheet's own counts.
- Mobile figures are not included. The chapter's mobile table shows Shopify at 25.3% of ecommerce sites, but that pivot divides mobile site counts by the desktop denominator. The sheet's own mobile column shows 21% for the same row.
- Detection and definitions. The Web Almanac uses HTTP Archive's fork of Wappalyzer v6.10.65. "All detection tools, including Wappalyzer, have their limitations", headless stores are harder to detect, and crawl geography matters. A site counts as ecommerce if it uses a known ecommerce platform or a technology that strongly implies an online store. W3Techs' disclaimer says it may not detect technologies "used only on some pages of a websites" and that its sample is not all websites.
- The Web Almanac figures are the July 2025 crawl (chapter published 2026/01/15). The 2026 edition's ecommerce chapter was not yet published on October 13, 2026. The results sheet is a live Google Sheet and the SQL was read from the main branch, so both could change after that date. The license of HTTP Archive's raw crawl data was not verified; the chapter footer reads "Licensed under Apache 2.0".
Caveats: Shopify plan prices and payment fees, US and Canada
- Current list prices only. Shopify's pricing pages were read on October 13, 2026. Shopify changes prices without notice and no price history was captured. Promotional offers such as "Try 3 days free, then $1/month for 3 months" are not list prices and are excluded.
- Region and geolocation. Shopify serves the US price list (USD) at /pricing and the Canadian list (CAD) at /ca/pricing. The two are not one exchange rate applied to each other: the CAD to USD price ratio runs from 1.25 for Grow billed yearly to 1.48 for Plus on a 3-year term. Fetching /pricing with Accept-Language fr-CA, en-CA or en-US, or with a localization cookie set to CA, returned identical prices, and the page state reads geoPricingIsEnabled=false. All fetches left from a US network exit, so a Canadian visitor's view of /pricing was not observed directly.
- Card rates are "from" rates for Shopify Payments, which is available only in some countries. Shopify's Plus page says "Card rates vary by country". The Plus card rates used here (2.25% + 30 cents in the US, 2.15% + 30 cents in Canada) are those printed in the pricing table.
- Plus has two published prices (3-year term and 1-year term) and an unpublished alternative: "More complex, higher volume businesses switch to a variable platform fee based on their revenue and business model." Shopify publishes no percentage or threshold for that fee, so a business on it has a different break-even than any row here. Plus includes the main store and 9 expansion stores. Extra stores cost $300 USD (US page) or $450 CAD (Canada page) per month each, or a revenue share.
- Break-even method. Monthly cost is the monthly subscription plus the variable rate times monthly sales. Plus equals Advanced at x = (plusFixed minus advFixed) / (advRate minus plusRate), with rates stored as fractions (0.025 is 2.5%). The per-transaction fixed fee (30 cents on both plans in both countries) cancels. The result counts only the subscription and the card or third-party percentage, and it ignores international and premium-card surcharges, in-person and POS fees, apps, themes, taxes, extra stores and the variable platform fee. Scenarios (a) and (b) assume all sales are standard online cards through Shopify Payments. Scenarios (c) and (d) assume all sales go through a third-party gateway, where Shopify's third-party transaction fee applies (2%, 1%, 0.6% and 0.2% by plan) and the processor's own fees, equal under either plan, cancel.
- Advanced is priced billed yearly (US$299 and C$389 per month, paid yearly). Billed monthly it costs more (US$399 and C$517), which lowers the break-even, and those scenarios are not computed. Plus needs a 1-year or 3-year commitment: "you can cancel when your term commitment expires".
- Canadian specifics. In-person card rates for Plus (2.4% + 0 cents) equal Advanced's as printed. Canadian "Online international rates" are flat (3.5%, 3.4%, 3.3% and 3.15% + 30 cents CAD) where the US page shows "+ 1%" on top of the card rate, and Canada lists Amex rates where the US lists premium card rates. In the US comparison table the fixed part of a card fee prints as 30¢ without a currency code, but the plan cards name it ("Card rates from 2.9% + 30¢ USD"), so fixed fees are US dollars in US rows and Canadian dollars in Canadian rows.
- The Help Center page on third-party transaction fees could not be fetched by script (bot check, HTTP 403), so the rates used come from the pricing pages and the Plus page. A fifth plan, Agentic ($0 a month, "For selling in AI channels", card rates from 2.9% + 30¢ USD online and 2.8% + 30¢ CAD online), has no in-person or third-party fee rows and is not part of the break-even rows.
Deploi's charts and compilation are licensed CC BY 4.0. The underlying facts belong to their sources, which are named on every page. How Deploi Shopify Data works.
Sources
Tier A sources are primary documents: filings, official releases and official price pages. How sources are ranked.
Shopify annual metrics, fiscal years 2015 to 2025
Show all 34 sources
- Tier ASEC EDGAR XBRL companyfacts API, Shopify Inc. (CIK 0001594805)
U.S. Securities and Exchange Commission (EDGAR) · TEXT · Read on
- Tier AShopify Inc., management's discussion and analysis for FY2016 (Exhibit to Form 40-F), filed 2017-02-15
Shopify Inc. · HTML · Read on
- Tier AShopify Inc., Q4 and full-year 2015 results press release (Form 6-K, main document), filed 2016-02-17
Shopify Inc. · HTML · Read on
- Tier AShopify Inc., Q4 and full-year 2016 results press release (Form 6-K, Exhibit 99.1), filed 2017-02-15
Shopify Inc. · HTML · Read on
- Tier AShopify Inc., management's discussion and analysis for FY2017 (Exhibit to Form 40-F), filed 2018-02-15
Shopify Inc. · HTML · Read on
- Tier AShopify Inc., Q4 and full-year 2017 results press release (Form 6-K, Exhibit 99.1), filed 2018-02-15
Shopify Inc. · HTML · Read on
- Tier AShopify Inc., management's discussion and analysis for FY2018 (Exhibit to Form 40-F), filed 2019-02-12
Shopify Inc. · HTML · Read on
- Tier AShopify Inc., XBRL instance document shop-20181231.xml of Form 40-F, filed 2019-02-12
Shopify Inc. · XBRL · Read on
- Tier AShopify Inc., Q4 and full-year 2018 results press release (Form 6-K, Exhibit 99.1), filed 2019-02-12
Shopify Inc. · HTML · Read on
- Tier AShopify Inc., management's discussion and analysis for FY2019 (Exhibit to Form 40-F), filed 2020-02-12
Shopify Inc. · HTML · Read on
- Tier AShopify Inc., XBRL instance document form40-f2019_htm.xml of Form 40-F, filed 2020-02-12
Shopify Inc. · XBRL · Read on
- Tier AShopify Inc., management's discussion and analysis for FY2020 (Exhibit to Form 40-F), filed 2021-02-17
Shopify Inc. · HTML · Read on
- Tier AShopify Inc., XBRL instance document shop-20201231_htm.xml of Form 40-F, filed 2021-02-17
Shopify Inc. · XBRL · Read on
- Tier AShopify Inc., Q4 and full-year 2019 results press release (Form 6-K, Exhibit 99.1), filed 2020-02-12
Shopify Inc. · HTML · Read on
- Tier AShopify Inc., management's discussion and analysis for FY2021 (Exhibit to Form 40-F), filed 2022-02-16
Shopify Inc. · HTML · Read on
- Tier AShopify Inc., XBRL instance document shop-20211231_htm.xml of Form 40-F, filed 2022-02-16
Shopify Inc. · XBRL · Read on
- Tier AShopify Inc., Q4 and full-year 2020 results press release (Form 6-K, Exhibit 99.1), filed 2021-02-17
Shopify Inc. · HTML · Read on
- Tier AShopify Inc., management's discussion and analysis for FY2022 (Exhibit to Form 40-F), filed 2023-02-16
Shopify Inc. · HTML · Read on
- Tier AShopify Inc., XBRL instance document shop-20221231_htm.xml of Form 40-F, filed 2023-02-16
Shopify Inc. · XBRL · Read on
- Tier AShopify Inc., Q4 and full-year 2021 results press release (Form 6-K, Exhibit 99.1), filed 2022-02-16
Shopify Inc. · HTML · Read on
- Tier AShopify Inc., Form 10-K for the fiscal year ended December 31, 2024, filed 2025-02-11
Shopify Inc. · HTML · Read on
- Tier AShopify Inc., XBRL instance document shop-20241231_htm.xml of Form 10-K, filed 2025-02-11
Shopify Inc. · XBRL · Read on
- Tier AShopify Inc., management's discussion and analysis for FY2023 (Exhibit to Form 40-F), filed 2024-02-13
Shopify Inc. · HTML · Read on
- Tier AShopify Inc., Q4 and full-year 2022 results press release (Form 6-K, Exhibit 99.1), filed 2023-02-15
Shopify Inc. · HTML · Read on
- Tier AShopify Inc., Form 10-K for the fiscal year ended December 31, 2025, filed 2026-02-11
Shopify Inc. · HTML · Read on
- Tier AShopify Inc., XBRL instance document shop-20251231_htm.xml of Form 10-K, filed 2026-02-11
Shopify Inc. · XBRL · Read on
- Tier AShopify Inc., Q4 and full-year 2023 results press release (Form 6-K, Exhibit 99.1), filed 2024-02-13
Shopify Inc. · HTML · Read on
- Tier AShopify Inc., Q4 and full-year 2024 results press release (Form 8-K, Exhibit 99.1), filed 2025-02-11
Shopify Inc. · HTML · Read on
- Tier AShopify Inc., Q4 and full-year 2025 results press release (Form 8-K, Exhibit 99.1), filed 2026-02-11
Shopify Inc. · HTML · Read on
- Tier ASEC EDGAR submissions index for Shopify Inc. (CIK 0001594805)
U.S. Securities and Exchange Commission (EDGAR) · API · Read on
- Tier A
- Tier AShopify Inc., Q2 2025 results press release (Form 8-K, Exhibit 99.1), filed 2025-08-06
Shopify Inc. · HTML · Read on
- Tier AShopify Inc., Q1 2025 results press release (Form 8-K, Exhibit 99.1), filed 2025-05-08
Shopify Inc. · HTML · Read on
- Tier AShopify Inc., Q3 2023 results press release (Form 6-K, Exhibit 99.1), filed 2023-11-02
Shopify Inc. · HTML · Read on
Shopify Black Friday-Cyber Monday sales by year
Show all 21 sources
- Tier AOver $1 Billion Sold By Shopify Merchants During Black Friday and Cyber Monday Weekend (2017-11-28)
Shopify Inc. · HTML · Read on
- Tier ABlack Friday Cyber Monday 2018: An Analysis of Over $1.5 Billion in Sales (Shopify blog, 2018-11-28)
Shopify Inc. · HTML · Read on
- Tier A
- Tier A
- Tier A
- Tier AShopify Merchants Set New Black Friday Cyber Monday Record with $7.5 Billion in Sales (2022-11-29)
Shopify Inc. · HTML · Read on
- Tier AShopify merchants drive record-high $9.3 billion in Black Friday-Cyber Monday sales (2023-11-28)
Shopify Inc. · HTML · Read on
- Tier A
- Tier AShopify merchants generate record-breaking $14.6 billion in Black Friday Cyber Monday sales (2025-12-02)
Shopify Inc. · HTML · Read on
- Tier AShopify Inc., Q4 and full-year 2017 results press release (Form 6-K, Exhibit 99.1), filed 2018-02-15
Shopify Inc. · HTML · Read on
- Tier AShopify Inc., Q4 and full-year 2018 results press release (Form 6-K, Exhibit 99.1), filed 2019-02-12
Shopify Inc. · HTML · Read on
- Tier AShopify Inc., Q4 and full-year 2019 results press release (Form 6-K, Exhibit 99.1), filed 2020-02-12
Shopify Inc. · HTML · Read on
- Tier AForm 6-K Ex. 99.1, BFCM 2020 results press release (filed 2020-12-01)
Shopify Inc. · HTML · Read on
- Tier AForm 6-K Ex. 99.1, BFCM 2021 results press release (filed 2021-11-30)
Shopify Inc. · HTML · Read on
- Tier AForm 6-K/A Ex. 99.1, BFCM 2022 results press release, amended (filed 2022-11-29)
Shopify Inc. · HTML · Read on
- Tier AForm 6-K Ex. 99.1, BFCM 2022 results press release, original before amendment (filed 2022-11-29)
Shopify Inc. · HTML · Read on
- Tier AForm 6-K Ex. 99.1, BFCM 2023 results press release (filed 2023-11-28)
Shopify Inc. · HTML · Read on
- Tier AForm 6-K Ex. 99.1, BFCM 2024 results press release (filed 2024-12-03)
Shopify Inc. · HTML · Read on
- Tier AForm 8-K Ex. 99.1, BFCM 2025 results press release (filed 2025-12-02)
Shopify Inc. · HTML · Read on
- Tier AShopify Inc., Q4 and full-year 2016 results press release (Form 6-K, Exhibit 99.1), filed 2017-02-15
Shopify Inc. · HTML · Read on
- Tier ASEC EDGAR submissions index for Shopify Inc. (CIK 0001594805)
U.S. Securities and Exchange Commission (EDGAR) · API · Read on
Shopify revenue and merchants by region
Show all 10 sources
- Tier AShopify Inc., Form 10-K for the fiscal year ended December 31, 2024, filed 2025-02-11
Shopify Inc. · HTML · Read on
- Tier AShopify Inc., XBRL instance document shop-20241231_htm.xml of Form 10-K, filed 2025-02-11
Shopify Inc. · XBRL · Read on
- Tier AShopify Inc., annual information form for FY2022 (Exhibit 1 to Form 40-F), filed 2023-02-16
Shopify Inc. · HTML · Read on
- Tier AShopify Inc., Form 10-K for the fiscal year ended December 31, 2025, filed 2026-02-11
Shopify Inc. · HTML · Read on
- Tier AShopify Inc., XBRL instance document shop-20251231_htm.xml of Form 10-K, filed 2026-02-11
Shopify Inc. · XBRL · Read on
- Tier AShopify Inc., annual information form for FY2023 (Exhibit 1 to Form 40-F), filed 2024-02-13
Shopify Inc. · HTML · Read on
- Tier AShopify Inc., XBRL instance document shop-20221231_htm.xml of Form 40-F, filed 2023-02-16
Shopify Inc. · XBRL · Read on
- Tier AShopify Inc., Form 10-Q for the quarter ended March 31, 2025, filed 2025-05-08
Shopify Inc. · HTML · Read on
- Tier AShopify Inc., Form 10-Q for the quarter ended March 31, 2026, filed 2026-05-05
Shopify Inc. · HTML · Read on
- Tier AShopify Inc., Form 10-Q for the quarter ended June 30, 2026, filed 2026-08-05
Shopify Inc. · HTML · Read on
Shopify merchant counts at year-end, 2012 to 2025
Show all 24 sources
- Tier AShopify Inc., prospectus for its initial public offering (Form 424B4), filed 2015-05-21
Shopify Inc. · HTML · Read on
- Tier AShopify Inc., Form 20-F for the fiscal year ended December 31, 2015, filed 2016-02-17
Shopify Inc. · HTML · Read on
- Tier AShopify Inc., annual information form for FY2016 (Exhibit 1 to Form 40-F), filed 2017-02-15
Shopify Inc. · HTML · Read on
- Tier AShopify Inc., management's discussion and analysis for FY2017 (Exhibit to Form 40-F), filed 2018-02-15
Shopify Inc. · HTML · Read on
- Tier AShopify Inc., management's discussion and analysis for FY2016 (Exhibit to Form 40-F), filed 2017-02-15
Shopify Inc. · HTML · Read on
- Tier AShopify Inc., Q4 and full-year 2016 results press release (Form 6-K, Exhibit 99.1), filed 2017-02-15
Shopify Inc. · HTML · Read on
- Tier AShopify Inc., annual information form for FY2017 (Exhibit 1 to Form 40-F), filed 2018-02-15
Shopify Inc. · HTML · Read on
- Tier AShopify Inc., management's discussion and analysis for FY2018 (Exhibit to Form 40-F), filed 2019-02-12
Shopify Inc. · HTML · Read on
- Tier AShopify Inc., annual information form for FY2018 (Exhibit 1 to Form 40-F), filed 2019-02-12
Shopify Inc. · HTML · Read on
- Tier AShopify Inc., management's discussion and analysis for FY2019 (Exhibit to Form 40-F), filed 2020-02-12
Shopify Inc. · HTML · Read on
- Tier AShopify Inc., annual information form for FY2019 (Exhibit 1 to Form 40-F), filed 2020-02-12
Shopify Inc. · HTML · Read on
- Tier AShopify Inc., management's discussion and analysis for FY2020 (Exhibit to Form 40-F), filed 2021-02-17
Shopify Inc. · HTML · Read on
- Tier AShopify Inc., annual information form for FY2020 (Exhibit 1 to Form 40-F), filed 2021-02-17
Shopify Inc. · HTML · Read on
- Tier AShopify Inc., annual information form for FY2021 (Exhibit 1 to Form 40-F), filed 2022-02-16
Shopify Inc. · HTML · Read on
- Tier AShopify Inc., annual information form for FY2022 (Exhibit 1 to Form 40-F), filed 2023-02-16
Shopify Inc. · HTML · Read on
- Tier AShopify Inc., annual information form for FY2023 (Exhibit 1 to Form 40-F), filed 2024-02-13
Shopify Inc. · HTML · Read on
- Tier AShopify Inc., Form 10-K for the fiscal year ended December 31, 2024, filed 2025-02-11
Shopify Inc. · HTML · Read on
- Tier AShopify Inc., Form 10-K for the fiscal year ended December 31, 2025, filed 2026-02-11
Shopify Inc. · HTML · Read on
- Tier AShopify Inc., Q3 2019 results press release (Form 6-K, Exhibit 99.1), filed 2019-10-29
Shopify Inc. · HTML · Read on
- Tier AShopify Inc., Investor Overview presentation, Q4 2024
Shopify Inc. · PDF · Read on
- Tier AShopify Inc., Investor Overview presentation, Q4 2025
Shopify Inc. · PDF · Read on
- Tier ASEC Division of Corporation Finance, comment letter to Shopify Inc. on its Form 10-K for 2024, dated 2025-07-07
U.S. Securities and Exchange Commission (EDGAR) · PDF · Read on
- Tier AShopify Inc., response letter (CORRESP) to the SEC staff, dated 2025-08-06
Shopify Inc. · HTML · Read on
- Tier AShopify Inc., 2019 Year in Review (annual report letter, Form 6-K exhibit), filed 2020-04-21
Shopify Inc. · HTML · Read on
Shopify adoption by site popularity tier
Show all 12 sources
- Tier BShopify popularity broken down by Ranking
W3Techs (Q-Success DI Gelbmann GmbH) · HTML · Read on
- Tier BUsage Statistics and Market Share of Shopify, October 2026
W3Techs (Q-Success DI Gelbmann GmbH) · HTML · Read on
- Tier BW3Techs Terms of Use
W3Techs (Q-Success DI Gelbmann GmbH) · HTML · Read on
- Tier BW3Techs Technologies Overview (methodology)
W3Techs (Q-Success DI Gelbmann GmbH) · HTML · Read on
- Tier BW3Techs FAQ
W3Techs (Q-Success DI Gelbmann GmbH) · HTML · Read on
- Tier BW3Techs Disclaimer
W3Techs (Q-Success DI Gelbmann GmbH) · HTML · Read on
- Tier BEcommerce | 2025 | The Web Almanac by HTTP Archive
HTTP Archive (Web Almanac) · HTML · Read on
- Tier BMethodology | 2025 | The Web Almanac by HTTP Archive
HTTP Archive (Web Almanac) · HTML · Read on
- Tier BWeb Almanac 2025 Ecommerce results, tab top_vendors_crux_rank.sql (gid 301153684)
HTTP Archive (Web Almanac) · CSV · Read on
- Tier BWeb Almanac 2025 Ecommerce results, tab counts.sql (gid 1784928999)
HTTP Archive (Web Almanac) · CSV · Read on
- Tier BSQL: sql/2025/ecommerce/top_vendors_crux_rank.sql
HTTP Archive (Web Almanac) · API · Read on
- Tier BSQL: sql/2025/ecommerce/counts.sql
HTTP Archive (Web Almanac) · API · Read on
Shopify plan prices and payment fees, US and Canada
- Tier AShopify Pricing (United States, USD)
Shopify Inc. · HTML · Read on
- Tier AShopify Pricing (Canada, CAD)
Shopify Inc. · HTML · Read on
- Tier AShopify Plus pricing (USD)
Shopify Inc. · HTML · Read on
- Tier AShopify Plus pricing (CAD)
Shopify Inc. · HTML · Read on
- Tier AShopify Help Center: Shopify Plus plan (Localized Plus plan pricing)
Shopify Inc. · TEXT · Read on
Cite and reuse
Deploi's charts and compilation are licensed CC BY 4.0. The underlying facts belong to their sources, which are named on every page.
APA
Deploi. (2026). Shopify statistics, every number traced [Web page]. https://deploi.ca/shopify/data/shopify-statistics Retrieved October 13, 2026.
BibTeX
@misc{deploi_shopify_statistics_2026,
  author = {{Deploi}},
  title = {Shopify statistics, every number traced},
  year = {2026},
  url = {https://deploi.ca/shopify/data/shopify-statistics},
  note = {Accessed 2026-10-13}
}
Embed a chart
Embed: Shopify GMV reached $378.4 billion in 2025
Embed code
<iframe src="https://deploi.ca/embed/shopify/data/shopify-gmv-by-year" title="Shopify GMV reached $378.4 billion in 2025" loading="lazy" style="width:100%;height:600px;border:0"></iframe>
<p style="font:12px/1.4 Arial,sans-serif;margin:4px 0 0">Source: <a href="https://deploi.ca/shopify/data/shopify-statistics#chart-shopify-gmv-by-year">Deploi, Shopify GMV reached $378.4 billion in 2025</a></p>
Embed: Shopify BFCM sales hit $14.6 billion in 2025
Embed code
<iframe src="https://deploi.ca/embed/shopify/data/shopify-bfcm-sales-by-year" title="Shopify BFCM sales hit $14.6 billion in 2025" loading="lazy" style="width:100%;height:550px;border:0"></iframe>
<p style="font:12px/1.4 Arial,sans-serif;margin:4px 0 0">Source: <a href="https://deploi.ca/shopify/data/charts/shopify-bfcm-sales-by-year">Deploi, Shopify BFCM sales hit $14.6 billion in 2025</a></p>
Embed: Shopify revenue reached 3.05% of GMV in 2025
Embed code
<iframe src="https://deploi.ca/embed/shopify/data/shopify-revenue-share-of-gmv" title="Shopify revenue reached 3.05% of GMV in 2025" loading="lazy" style="width:100%;height:530px;border:0"></iframe>
<p style="font:12px/1.4 Arial,sans-serif;margin:4px 0 0">Source: <a href="https://deploi.ca/shopify/data/shopify-statistics#chart-shopify-revenue-share-of-gmv">Deploi, Shopify revenue reached 3.05% of GMV in 2025</a></p>
Embed: Shopify Payments handled 65.6% of GMV in 2025
Embed code
<iframe src="https://deploi.ca/embed/shopify/data/shopify-payments-penetration" title="Shopify Payments handled 65.6% of GMV in 2025" loading="lazy" style="width:100%;height:530px;border:0"></iframe>
<p style="font:12px/1.4 Arial,sans-serif;margin:4px 0 0">Source: <a href="https://deploi.ca/shopify/data/shopify-statistics#chart-shopify-payments-penetration">Deploi, Shopify Payments handled 65.6% of GMV in 2025</a></p>
Embed: The US has 44% of Shopify's merchants but 63% of its revenue
Embed code
<iframe src="https://deploi.ca/embed/shopify/data/shopify-merchants-vs-revenue-by-region" title="The US has 44% of Shopify's merchants but 63% of its revenue" loading="lazy" style="width:100%;height:560px;border:0"></iframe> <p style="font:12px/1.4 Arial,sans-serif;margin:4px 0 0">Source: <a href="https://deploi.ca/shopify/data/charts/shopify-merchants-vs-revenue-by-region">Deploi, The US has 44% of Shopify's merchants but 63% of its revenue</a></p>
Embed: Shopify Plus was 31% of recurring revenue in June 2024
Embed code
<iframe src="https://deploi.ca/embed/shopify/data/shopify-plus-share-of-mrr" title="Shopify Plus was 31% of recurring revenue in June 2024" loading="lazy" style="width:100%;height:550px;border:0"></iframe>
<p style="font:12px/1.4 Arial,sans-serif;margin:4px 0 0">Source: <a href="https://deploi.ca/shopify/data/shopify-statistics#chart-shopify-plus-share-of-mrr">Deploi, Shopify Plus was 31% of recurring revenue in June 2024</a></p>
Embed: Shopify last published a merchant count in 2021: 2,063,000
Embed code
<iframe src="https://deploi.ca/embed/shopify/data/shopify-merchant-count-by-year" title="Shopify last published a merchant count in 2021: 2,063,000" loading="lazy" style="width:100%;height:570px;border:0"></iframe>
<p style="font:12px/1.4 Arial,sans-serif;margin:4px 0 0">Source: <a href="https://deploi.ca/shopify/data/shopify-statistics#chart-shopify-merchant-count-by-year">Deploi, Shopify last published a merchant count in 2021: 2,063,000</a></p>
Embed: Shopify claims over 14% of US ecommerce sales
Embed code
<iframe src="https://deploi.ca/embed/shopify/data/shopify-us-ecommerce-share" title="Shopify claims over 14% of US ecommerce sales" loading="lazy" style="width:100%;height:550px;border:0"></iframe>
<p style="font:12px/1.4 Arial,sans-serif;margin:4px 0 0">Source: <a href="https://deploi.ca/shopify/data/shopify-statistics#chart-shopify-us-ecommerce-share">Deploi, Shopify claims over 14% of US ecommerce sales</a></p>
Embed: Shopify runs 31.6% of ecommerce sites ranked in the top million
Embed code
<iframe src="https://deploi.ca/embed/shopify/data/shopify-adoption-by-site-tier" title="Shopify runs 31.6% of ecommerce sites ranked in the top million" loading="lazy" style="width:100%;height:550px;border:0"></iframe>
<p style="font:12px/1.4 Arial,sans-serif;margin:4px 0 0">Source: <a href="https://deploi.ca/shopify/data/shopify-statistics#chart-shopify-adoption-by-site-tier">Deploi, Shopify runs 31.6% of ecommerce sites ranked in the top million</a></p>
Embed: Shopify Plus costs less than Advanced from US$800,400 a month
Embed code
<iframe src="https://deploi.ca/embed/shopify/data/shopify-plus-break-even" title="Shopify Plus costs less than Advanced from US$800,400 a month" loading="lazy" style="width:100%;height:1010px;border:0"></iframe>
<p style="font:12px/1.4 Arial,sans-serif;margin:4px 0 0">Source: <a href="https://deploi.ca/shopify/data/charts/shopify-plus-break-even">Deploi, Shopify Plus costs less than Advanced from US$800,400 a month</a></p>
Keep the credit line under the embed. It is the license condition.
Downloads
- Chart: Shopify GMV reached $378.4 billion in 2025 PNG
- Chart: Shopify BFCM sales hit $14.6 billion in 2025 PNG
- Chart: Shopify revenue reached 3.05% of GMV in 2025 PNG
- Chart: Shopify Payments handled 65.6% of GMV in 2025 PNG
- Chart: The US has 44% of Shopify's merchants but 63% of its revenue PNG
- Chart: Shopify Plus was 31% of recurring revenue in June 2024 PNG
- Chart: Shopify last published a merchant count in 2021: 2,063,000 PNG
- Chart: Shopify claims over 14% of US ecommerce sales PNG
- Chart: Shopify runs 31.6% of ecommerce sites ranked in the top million PNG
- Chart: Shopify Plus costs less than Advanced from US$800,400 a month PNG
- Data: Shopify annual metrics, fiscal years 2015 to 2025 CSV
- Data: Shopify Black Friday-Cyber Monday sales by year CSV
- Data: Shopify revenue and merchants by region CSV
- Data: Shopify Plus share of monthly recurring revenue CSV
- Data: Shopify merchant counts at year-end, 2012 to 2025 CSV
- Data: Shopify's stated share of US ecommerce CSV
- Data: Shopify adoption by site popularity tier CSV
- Data: Shopify plan prices and payment fees, US and Canada CSV
Questions
How much revenue did Shopify earn in 2025?
Shopify earned $11,556 million of revenue in fiscal 2025, about $11.6 billion and up 30% from $8,880 million in 2024, according to its Form 10-K filed February 11, 2026. Subscription Solutions was $2,752 million and Merchant Solutions $8,804 million.
Is gross merchandise volume the same as Shopify's revenue?
No. GMV is the value of orders on the platform: $378,441 million in fiscal 2025. Revenue is what Shopify earns: $11,556 million, or 3.05% of GMV. Shopify states that GMV does not represent revenue earned by Shopify.
How many merchants does Shopify have?
Shopify last published a merchant count for year-end 2021: approximately 2,063,000. Since then it says only "millions of merchants", including in its Form 10-K for 2025.
What share of the US ecommerce market does Shopify have?
Shopify states over 14% of US ecommerce for 2025, based on its US GMV excluding point of sale. Over means more than 14%. Shopify does not publish its US GMV, so the percentage cannot be recomputed.
How much did Shopify merchants sell on Black Friday-Cyber Monday 2025?
Shopify merchants sold $14.6 billion worldwide over Black Friday-Cyber Monday weekend 2025, up 27% from $11.5 billion in 2024, with 81+ million buyers counted by unique buyer email. Shopify announced the figures on December 2, 2025.
When does Shopify Plus cost less than Advanced?
On list prices, Plus on a 3-year term costs less than Advanced billed yearly above $800,400 a month in US online sales. The Canadian break-even is C$1,204,400. Both use Shopify Payments card rates. Apps, taxes and the variable platform fee are not included.
More on Shopify the company
- Which Shopify business metrics has the company stopped reporting, and when?
Shopify has stopped reporting its merchant count, its Plus merchant count and the Plus share of MRR, while GMV and MRR are still reported, according to Shopify's results and filings read through Q2 2026. Updated October 19, 2026.
- Which product areas dominate Shopify's latest Edition, and is the mix shifting toward AI?
AI items made up 8.3% of Shopify's Spring '26 Edition, 17 of 206 items, after 10.6% in Winter '26, according to Deploi's counts of Shopify's Edition pages. Updated October 18, 2026.
Changes
- · Shopify annual metrics, fiscal years 2015 to 2025
First release. Eleven fiscal years (2015 to 2025). Revenue and its two lines are read by script from the SEC's structured filing data. GMV, recurring revenue and payments figures are read from annual reports and results releases. Restated, revised and rounded figures are recorded in row notes and caveats. Deploi added three computed columns. - · Shopify Black Friday-Cyber Monday sales by year
First release. Nine years (2017 to 2025) read from Shopify's announcement pages and checked against its SEC filings. The 2018 restatement and a 2022 correction to the consumer-growth figure are recorded. - · Shopify revenue and merchants by region
First release. Twenty rows (five regions, fiscal years 2022 to 2025) from the Forms 10-K for 2024 and 2025, with merchant shares from Shopify's annual reports. The 2026 change of region labels is documented from Shopify's quarterly reports for 2025 and 2026. - · Shopify Plus share of monthly recurring revenue
First release. Thirty-four quarter-ends (March 2016 to June 2024) from Shopify's results releases. The restated March and June 2023 shares and the conflicting December 2022 figure are recorded. A search of every later results release and filing, through the second quarter of 2026, found no further Plus share of MRR. - · Shopify merchant counts at year-end, 2012 to 2025
First release. Fourteen year-ends (2012 to 2025) from Shopify's IPO prospectus, annual reports and results releases. The end of the numeric series (2021) and Shopify's 2025 letter to the SEC are recorded. Deploi added one computed flag column. - · Shopify's stated share of US ecommerce
First release. Seventeen statements (14 investor decks, 2 SEC-filed results releases and 1 year-in-review rank claim) read for six years of sales. Other SEC documents and year-in-review letters were scanned for further statements. A 2021 chart value was read from a slide image and appears in a note only. - · Shopify adoption by site popularity tier
First release. W3Techs ranking breakdown read on October 13, 2026. Web Almanac 2025 desktop tier data read from its results sheet and checked against the chapter text, the query code and the site counts. - · Shopify plan prices and payment fees, US and Canada
First release. US and Canada list prices and fees read from Shopify's pricing pages on October 13, 2026. Deploi computed the break-even rows and recorded its checks on which price list each country sees.